| Business / Energy Data |
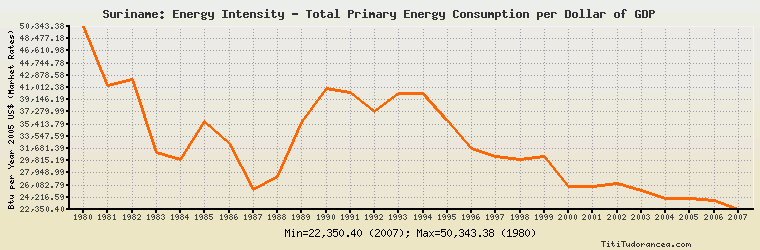
Suriname: Energy Intensity - Total Primary Energy Consumption per Dollar of GDP
Btu per Year 2005 U.S. Dollars (Market Exchange Rates)
| Year | Suriname | Change, percent | Suriname, percent of Central & South America | Suriname, percent of World |
| 1980 | 50,343.379 | N/A | 476.652% | N/A |
| 1981 | 41,281.353 | -18.000% | 385.706% | N/A |
| 1982 | 42,171.797 | 2.157% | 392.464% | N/A |
| 1983 | 31,093.154 | -26.270% | 287.601% | N/A |
| 1984 | 30,003.916 | -3.503% | 270.481% | N/A |
| 1985 | 35,745.757 | 19.137% | 326.882% | N/A |
| 1986 | 32,507.482 | -9.059% | 298.202% | N/A |
| 1987 | 25,375.308 | -21.940% | 236.002% | N/A |
| 1988 | 27,448.535 | 8.170% | 251.415% | N/A |
| 1989 | 35,678.121 | 29.982% | 318.958% | N/A |
| 1990 | 40,886.085 | 14.597% | 352.969% | N/A |
| 1991 | 40,289.406 | -1.459% | 343.376% | 353.901% |
| 1992 | 37,280.379 | -7.469% | 321.062% | 333.221% |
| 1993 | 40,165.972 | 7.740% | 343.367% | 359.796% |
| 1994 | 40,142.654 | -0.058% | 344.655% | 366.409% |
| 1995 | 35,956.994 | -10.427% | 306.878% | 330.514% |
| 1996 | 31,677.460 | -11.902% | 264.165% | 292.927% |
| 1997 | 30,402.730 | -4.024% | 252.340% | 287.141% |
| 1998 | 29,946.672 | -1.500% | 243.694% | 288.527% |
| 1999 | 30,404.787 | 1.530% | 244.513% | 297.126% |
| 2000 | 25,802.862 | -15.136% | 208.732% | 257.673% |
| 2001 | 25,930.222 | 0.494% | 209.498% | 261.147% |
| 2002 | 26,259.316 | 1.269% | 213.379% | 263.140% |
| 2003 | 25,282.084 | -3.721% | 204.623% | 250.814% |
| 2004 | 24,048.280 | -4.880% | 199.367% | 235.341% |
| 2005 | 24,048.523 | 0.001% | 200.928% | 236.477% |
| 2006 | 23,748.100 | -1.249% | 196.186% | 237.599% |
| 2007 | 22,350.396 | -5.886% | 212.681% | 234.479% |
| 2008 | N/A | N/A | N/A | N/A |
| 2009 | N/A | N/A | N/A | N/A |
| 2010 | N/A | N/A | N/A | N/A |
Historical Energy Data about Suriname
Total Oil Supply
Total Consumption of Petroleum Products
Oil and Petroleum Products, Net Exports/Imports (-)
Production of Crude Oil including Lease Condensate
Crude Oil Proved Reserves
Dry Natural Gas, Net Exports/Imports (-)
Total Coal Consumption
Coal, Net Exports/Imports (-)
Total Electricity Net Generation
Total Electricity Net Consumption
Electricity, Net Exports/Imports (-)
Total Conventional Thermal Electricity Net Generation
Hydroelectricity Net Generation
Total Primary Energy Production
Total Primary Energy Consumption
Total Carbon Dioxide Emissions from the Consumption of Energy
Population