| Business / Energy Data |
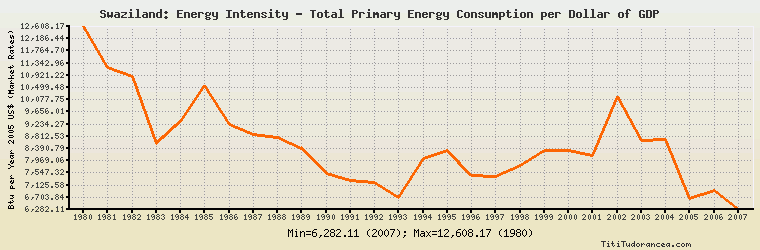
Swaziland: Energy Intensity - Total Primary Energy Consumption per Dollar of GDP
Btu per Year 2005 U.S. Dollars (Market Exchange Rates)
| Year | Swaziland | Change, percent | Swaziland, percent of Africa | Swaziland, percent of World |
| 1980 | 12,608.174 | N/A | 94.761% | N/A |
| 1981 | 11,182.724 | -11.306% | 81.643% | N/A |
| 1982 | 10,864.693 | -2.844% | 74.114% | N/A |
| 1983 | 8,579.104 | -21.037% | 56.252% | N/A |
| 1984 | 9,318.263 | 8.616% | 59.932% | N/A |
| 1985 | 10,582.909 | 13.572% | 68.557% | N/A |
| 1986 | 9,235.211 | -12.735% | 59.297% | N/A |
| 1987 | 8,869.603 | -3.959% | 56.367% | N/A |
| 1988 | 8,779.168 | -1.020% | 56.153% | N/A |
| 1989 | 8,391.877 | -4.411% | 55.696% | N/A |
| 1990 | 7,528.594 | -10.287% | 49.213% | N/A |
| 1991 | 7,298.897 | -3.051% | 46.888% | 64.113% |
| 1992 | 7,198.550 | -1.375% | 45.821% | 64.342% |
| 1993 | 6,708.314 | -6.810% | 42.755% | 60.091% |
| 1994 | 8,045.804 | 19.938% | 50.328% | 73.440% |
| 1995 | 8,327.673 | 3.503% | 51.990% | 76.547% |
| 1996 | 7,446.869 | -10.577% | 47.731% | 68.862% |
| 1997 | 7,419.290 | -0.370% | 47.067% | 70.072% |
| 1998 | 7,800.487 | 5.138% | 50.052% | 75.155% |
| 1999 | 8,317.619 | 6.629% | 53.099% | 81.283% |
| 2000 | 8,316.791 | -0.010% | 53.027% | 83.053% |
| 2001 | 8,139.777 | -2.128% | 51.160% | 81.977% |
| 2002 | 10,181.527 | 25.084% | 65.726% | 102.027% |
| 2003 | 8,668.754 | -14.858% | 56.036% | 85.999% |
| 2004 | 8,705.960 | 0.429% | 56.677% | 85.198% |
| 2005 | 6,655.083 | -23.557% | 44.089% | 65.442% |
| 2006 | 6,938.233 | 4.255% | 47.930% | 69.417% |
| 2007 | 6,282.105 | -9.457% | 46.590% | 65.906% |
| 2008 | N/A | N/A | N/A | N/A |
| 2009 | N/A | N/A | N/A | N/A |
| 2010 | N/A | N/A | N/A | N/A |
Historical Energy Data about Swaziland
Total Consumption of Petroleum Products
Oil and Petroleum Products, Net Exports/Imports (-)
Dry Natural Gas, Net Exports/Imports (-)
Total Primary Coal Production
Total Coal Consumption
Coal, Net Exports/Imports (-)
Total Recoverable Coal
Total Electricity Net Generation
Total Electricity Net Consumption
Total Electricity Imports
Electricity, Net Exports/Imports (-)
Total Conventional Thermal Electricity Net Generation
Hydroelectricity Net Generation
Total Primary Energy Production
Total Primary Energy Consumption
Total Carbon Dioxide Emissions from the Consumption of Energy
Population