| Business / Demographics |
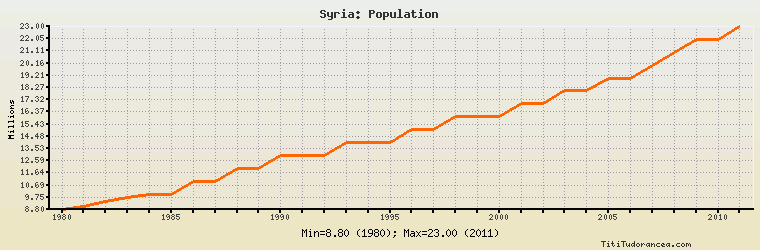
Syria: Population
Millions
| Year | Syria | Change, percent | Syria, percent of Middle East | Syria, percent of World |
| 1980 | 8.800 | N/A | 9.244% | 0.198% |
| 1981 | 9.000 | 2.273% | 9.073% | 0.199% |
| 1982 | 9.400 | 4.444% | 9.189% | 0.204% |
| 1983 | 9.700 | 3.191% | 9.032% | 0.207% |
| 1984 | 10.000 | 3.093% | 9.001% | 0.210% |
| 1985 | 10.000 | 0.000% | 8.643% | 0.206% |
| 1986 | 11.000 | 10.000% | 9.220% | 0.223% |
| 1987 | 11.000 | 0.000% | 8.878% | 0.219% |
| 1988 | 12.000 | 9.091% | 9.346% | 0.235% |
| 1989 | 12.000 | 0.000% | 9.029% | 0.231% |
| 1990 | 13.000 | 8.333% | 9.510% | 0.246% |
| 1991 | 13.000 | 0.000% | 9.400% | 0.242% |
| 1992 | 13.000 | 0.000% | 9.047% | 0.238% |
| 1993 | 14.000 | 7.692% | 9.421% | 0.253% |
| 1994 | 14.000 | 0.000% | 9.315% | 0.249% |
| 1995 | 14.000 | 0.000% | 9.021% | 0.246% |
| 1996 | 15.000 | 7.143% | 9.506% | 0.260% |
| 1997 | 15.000 | 0.000% | 9.231% | 0.256% |
| 1998 | 16.000 | 6.667% | 9.685% | 0.270% |
| 1999 | 16.000 | 0.000% | 9.412% | 0.266% |
| 2000 | 16.000 | 0.000% | 9.270% | 0.263% |
| 2001 | 17.000 | 6.250% | 9.583% | 0.276% |
| 2002 | 17.000 | 0.000% | 9.444% | 0.272% |
| 2003 | 18.000 | 5.882% | 9.746% | 0.285% |
| 2004 | 18.000 | 0.000% | 9.657% | 0.281% |
| 2005 | 19.000 | 5.556% | 9.927% | 0.294% |
| 2006 | 19.000 | 0.000% | 9.719% | 0.290% |
| 2007 | 20.000 | 5.263% | 9.965% | 0.302% |
| 2008 | 21.000 | 5.000% | 10.269% | 0.313% |
| 2009 | 22.000 | 4.762% | 10.501% | 0.324% |
| 2010 | 22.000 | 0.000% | 10.309% | 0.320% |
| 2011 | 23.000 | 4.545% | 10.599% | 0.331% |
Historical Energy Data about Syria
Total Oil Supply
Total Consumption of Petroleum Products
Oil and Petroleum Products, Net Exports/Imports (-)
Production of Crude Oil including Lease Condensate
Crude Oil Proved Reserves
Dry Natural Gas Production
Dry Natural Gas Consumption
Dry Natural Gas, Net Exports/Imports (-)
Proved Reserves of Natural Gas
Total Coal Consumption
Coal, Net Exports/Imports (-)
Total Electricity Net Generation
Total Electricity Net Consumption
Total Electricity Exports
Total Electricity Imports
Electricity, Net Exports/Imports (-)
Total Conventional Thermal Electricity Net Generation
Hydroelectricity Net Generation
Total Primary Energy Production
Total Primary Energy Consumption
Total Carbon Dioxide Emissions from the Consumption of Energy
Population