| Business / Energy Data |
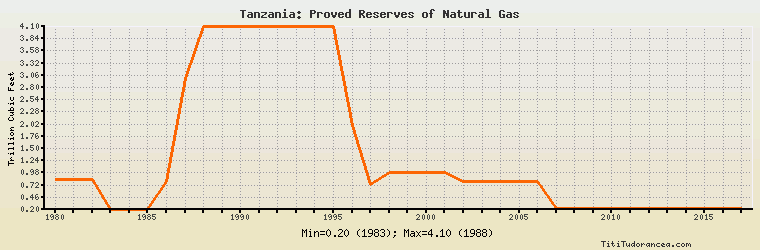
Tanzania: Proved Reserves of Natural Gas
Trillion Cubic Feet
| Year | Tanzania | Change, percent | Tanzania, percent of Africa | Tanzania, percent of World |
| 1980 | 0.848 | N/A | 0.402% | 0.033% |
| 1981 | 0.848 | 0.000% | 0.396% | 0.032% |
| 1982 | 0.848 | 0.000% | 0.398% | 0.029% |
| 1983 | 0.200 | -76.415% | 0.105% | 0.007% |
| 1984 | 0.200 | 0.000% | 0.103% | 0.006% |
| 1985 | 0.200 | 0.000% | 0.105% | 0.006% |
| 1986 | 0.800 | 300.000% | 0.393% | 0.023% |
| 1987 | 3.000 | 275.000% | 1.427% | 0.082% |
| 1988 | 4.100 | 36.667% | 1.608% | 0.108% |
| 1989 | 4.100 | 0.000% | 1.595% | 0.105% |
| 1990 | 4.100 | 0.000% | 1.510% | 0.103% |
| 1991 | 4.100 | 0.000% | 1.415% | 0.097% |
| 1992 | 4.100 | 0.000% | 1.318% | 0.156% |
| 1993 | 4.100 | 0.000% | 1.179% | 0.139% |
| 1994 | 4.100 | 0.000% | 1.193% | 0.136% |
| 1995 | 4.100 | 0.000% | 1.200% | 0.136% |
| 1996 | 2.000 | -51.220% | 0.598% | 0.068% |
| 1997 | 0.726 | -63.700% | 0.221% | 0.015% |
| 1998 | 0.980 | 34.986% | 0.281% | 0.019% |
| 1999 | 0.980 | 0.000% | 0.271% | 0.019% |
| 2000 | 0.980 | 0.000% | 0.248% | 0.019% |
| 2001 | 0.980 | 0.000% | 0.248% | 0.019% |
| 2002 | 0.800 | -18.367% | 0.202% | 0.015% |
| 2003 | 0.800 | 0.000% | 0.191% | 0.015% |
| 2004 | 0.800 | 0.000% | 0.176% | 0.013% |
| 2005 | 0.800 | 0.000% | 0.168% | 0.013% |
| 2006 | 0.800 | 0.000% | 0.165% | 0.013% |
| 2007 | 0.230 | -71.250% | 0.047% | 0.004% |
| 2008 | 0.230 | 0.000% | 0.047% | 0.004% |
| 2009 | 0.230 | 0.000% | 0.046% | 0.004% |
| 2010 | 0.230 | 0.000% | 0.046% | 0.003% |
| 2011 | 0.230 | 0.000% | 0.044% | 0.003% |
| 2012 | 0.230 | 0.000% | 0.045% | 0.003% |
| 2013 | 0.230 | 0.000% | 0.045% | 0.003% |
| 2014 | 0.230 | 0.000% | 0.038% | 0.003% |
| 2015 | 0.230 | 0.000% | 0.038% | 0.003% |
| 2016 | 0.230 | 0.000% | 0.038% | 0.003% |
| 2017 | 0.230 | 0.000% | 0.038% | N/A |
Historical Energy Data about Tanzania
Total Oil Supply
Total Consumption of Petroleum Products
Oil and Petroleum Products, Net Exports/Imports (-)
Dry Natural Gas Production
Dry Natural Gas Consumption
Dry Natural Gas, Net Exports/Imports (-)
Proved Reserves of Natural Gas
Total Primary Coal Production
Total Coal Consumption
Coal, Net Exports/Imports (-)
Total Recoverable Coal
Total Electricity Net Generation
Total Electricity Net Consumption
Total Electricity Imports
Electricity, Net Exports/Imports (-)
Total Conventional Thermal Electricity Net Generation
Hydroelectricity Net Generation
Total Primary Energy Production
Total Primary Energy Consumption
Total Carbon Dioxide Emissions from the Consumption of Energy
Population