| Business / Energy Data |
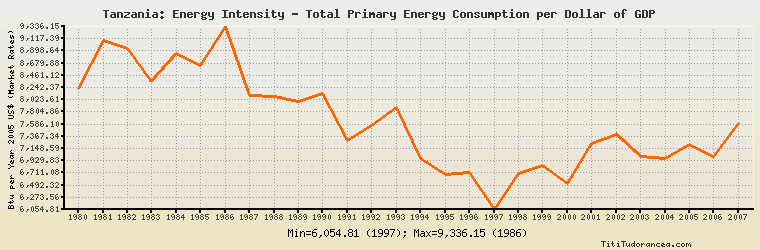
Tanzania: Energy Intensity - Total Primary Energy Consumption per Dollar of GDP
Btu per Year 2005 U.S. Dollars (Market Exchange Rates)
| Year | Tanzania | Change, percent | Tanzania, percent of Africa | Tanzania, percent of World |
| 1980 | 8,223.382 | N/A | 61.805% | N/A |
| 1981 | 9,088.364 | 10.519% | 66.353% | N/A |
| 1982 | 8,933.308 | -1.706% | 60.939% | N/A |
| 1983 | 8,357.220 | -6.449% | 54.797% | N/A |
| 1984 | 8,858.097 | 5.993% | 56.972% | N/A |
| 1985 | 8,642.372 | -2.435% | 55.986% | N/A |
| 1986 | 9,336.148 | 8.028% | 59.946% | N/A |
| 1987 | 8,095.568 | -13.288% | 51.448% | N/A |
| 1988 | 8,075.506 | -0.248% | 51.652% | N/A |
| 1989 | 7,993.250 | -1.019% | 53.051% | N/A |
| 1990 | 8,143.326 | 1.878% | 53.231% | N/A |
| 1991 | 7,283.337 | -10.561% | 46.788% | 63.977% |
| 1992 | 7,555.986 | 3.743% | 48.097% | 67.537% |
| 1993 | 7,880.713 | 4.298% | 50.228% | 70.593% |
| 1994 | 6,976.955 | -11.468% | 43.642% | 63.683% |
| 1995 | 6,673.616 | -4.348% | 41.664% | 61.343% |
| 1996 | 6,714.790 | 0.617% | 43.039% | 62.093% |
| 1997 | 6,054.809 | -9.829% | 38.411% | 57.185% |
| 1998 | 6,693.664 | 10.551% | 42.950% | 64.491% |
| 1999 | 6,846.971 | 2.290% | 43.711% | 66.911% |
| 2000 | 6,514.716 | -4.853% | 41.537% | 65.057% |
| 2001 | 7,231.752 | 11.006% | 45.453% | 72.832% |
| 2002 | 7,397.856 | 2.297% | 47.756% | 74.133% |
| 2003 | 7,013.409 | -5.197% | 45.335% | 69.577% |
| 2004 | 6,967.170 | -0.659% | 45.357% | 68.182% |
| 2005 | 7,213.130 | 3.530% | 47.786% | 70.929% |
| 2006 | 7,000.336 | -2.950% | 48.359% | 70.038% |
| 2007 | 7,599.689 | 8.562% | 56.362% | 79.729% |
| 2008 | N/A | N/A | N/A | N/A |
| 2009 | N/A | N/A | N/A | N/A |
| 2010 | N/A | N/A | N/A | N/A |
Historical Energy Data about Tanzania
Total Oil Supply
Total Consumption of Petroleum Products
Oil and Petroleum Products, Net Exports/Imports (-)
Dry Natural Gas Production
Dry Natural Gas Consumption
Dry Natural Gas, Net Exports/Imports (-)
Proved Reserves of Natural Gas
Total Primary Coal Production
Total Coal Consumption
Coal, Net Exports/Imports (-)
Total Recoverable Coal
Total Electricity Net Generation
Total Electricity Net Consumption
Total Electricity Imports
Electricity, Net Exports/Imports (-)
Total Conventional Thermal Electricity Net Generation
Hydroelectricity Net Generation
Total Primary Energy Production
Total Primary Energy Consumption
Total Carbon Dioxide Emissions from the Consumption of Energy
Population