| Business / Energy Data |
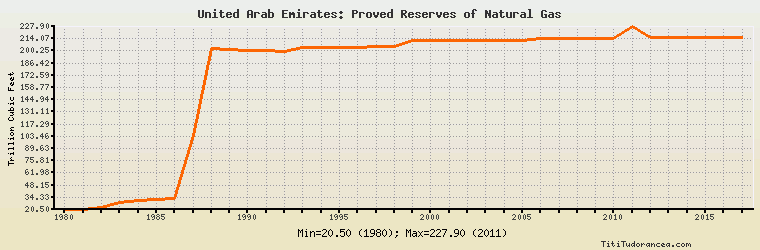
United Arab Emirates: Proved Reserves of Natural Gas
Trillion Cubic Feet
| Year | United Arab Emirates | Change, percent | United Arab Emirates, percent of Middle East | United Arab Emirates, percent of World |
| 1980 | 20.500 | N/A | 2.771% | 0.793% |
| 1981 | 20.775 | 1.341% | 2.763% | 0.785% |
| 1982 | 23.250 | 11.913% | 3.052% | 0.796% |
| 1983 | 28.580 | 22.925% | 3.716% | 0.943% |
| 1984 | 31.220 | 9.237% | 4.033% | 0.975% |
| 1985 | 31.970 | 2.402% | 3.677% | 0.940% |
| 1986 | 32.800 | 2.596% | 3.832% | 0.942% |
| 1987 | 104.600 | 218.902% | 11.305% | 2.873% |
| 1988 | 203.500 | 94.551% | 18.756% | 5.371% |
| 1989 | 201.515 | -0.975% | 17.047% | 5.139% |
| 1990 | 200.800 | -0.355% | 16.377% | 5.044% |
| 1991 | 200.400 | -0.199% | 15.133% | 4.754% |
| 1992 | 199.300 | -0.549% | 15.109% | 7.588% |
| 1993 | 204.600 | 2.659% | 13.459% | 6.956% |
| 1994 | 204.600 | 0.000% | 12.942% | 6.783% |
| 1995 | 204.600 | 0.000% | 12.834% | 6.811% |
| 1996 | 204.600 | 0.000% | 12.810% | 6.917% |
| 1997 | 204.900 | 0.147% | 12.671% | 4.142% |
| 1998 | 204.900 | 0.000% | 11.871% | 4.028% |
| 1999 | 212.000 | 3.465% | 12.117% | 4.123% |
| 2000 | 212.000 | 0.000% | 12.120% | 4.117% |
| 2001 | 212.100 | 0.047% | 11.435% | 4.010% |
| 2002 | 212.100 | 0.000% | 10.742% | 3.887% |
| 2003 | 212.100 | 0.000% | 10.714% | 3.853% |
| 2004 | 212.100 | 0.000% | 8.423% | 3.489% |
| 2005 | 212.100 | 0.000% | 8.410% | 3.509% |
| 2006 | 214.400 | 1.084% | 8.357% | 3.501% |
| 2007 | 214.400 | 0.000% | 8.355% | 3.463% |
| 2008 | 214.400 | 0.000% | 8.411% | 3.451% |
| 2009 | 214.400 | 0.000% | 8.273% | 3.424% |
| 2010 | 214.400 | 0.000% | 8.065% | 3.230% |
| 2011 | 227.900 | 6.297% | 8.484% | 3.398% |
| 2012 | 215.035 | -5.645% | 7.680% | 3.158% |
| 2013 | 215.025 | -0.005% | 7.616% | 3.141% |
| 2014 | 215.035 | 0.005% | 7.645% | 3.084% |
| 2015 | 215.098 | 0.029% | 7.633% | 3.095% |
| 2016 | 215.098 | 0.000% | 7.632% | 3.127% |
| 2017 | 215.098 | 0.000% | 7.701% | N/A |
Historical Energy Data about United Arab Emirates
Total Oil Supply
Total Consumption of Petroleum Products
Oil and Petroleum Products, Net Exports/Imports (-)
Production of Crude Oil including Lease Condensate
Crude Oil Proved Reserves
Dry Natural Gas Production
Dry Natural Gas Consumption
Dry Natural Gas, Net Exports/Imports (-)
Proved Reserves of Natural Gas
Coal, Net Exports/Imports (-)
Total Electricity Net Generation
Total Electricity Net Consumption
Electricity, Net Exports/Imports (-)
Total Conventional Thermal Electricity Net Generation
Total Primary Energy Production
Total Primary Energy Consumption
Total Carbon Dioxide Emissions from the Consumption of Energy
Population