| Business / Energy Data |
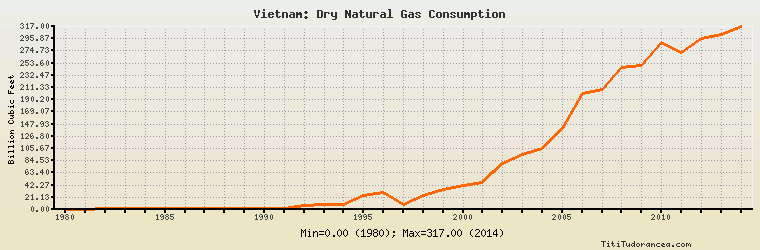
Vietnam: Dry Natural Gas Consumption
Billion Cubic Feet
| Year | Vietnam | Change, percent | Vietnam, percent of Asia & Oceania | Vietnam, percent of World |
| 1980 | 0.000 | N/A | 0.00% | 0.00% |
| 1981 | 0.400 | 0.000% | 0.015% | 0.001% |
| 1982 | 2.300 | 475.000% | 0.082% | 0.004% |
| 1983 | 2.300 | 0.000% | 0.076% | 0.004% |
| 1984 | 2.100 | -8.696% | 0.058% | 0.004% |
| 1985 | 1.400 | -33.333% | 0.035% | 0.002% |
| 1986 | 1.400 | 0.000% | 0.032% | 0.002% |
| 1987 | 1.400 | 0.000% | 0.030% | 0.002% |
| 1988 | 1.100 | -21.429% | 0.022% | 0.002% |
| 1989 | 1.100 | 0.000% | 0.021% | 0.002% |
| 1990 | 1.400 | 27.273% | 0.024% | 0.002% |
| 1991 | 2.500 | 78.571% | 0.040% | 0.003% |
| 1992 | 7.400 | 196.000% | 0.113% | 0.010% |
| 1993 | 8.800 | 18.919% | 0.126% | 0.011% |
| 1994 | 8.800 | 0.000% | 0.116% | 0.011% |
| 1995 | 25.000 | 184.091% | 0.313% | 0.032% |
| 1996 | 29.000 | 16.000% | 0.333% | 0.036% |
| 1997 | 8.100 | -72.069% | 0.089% | 0.010% |
| 1998 | 25.000 | 208.642% | 0.271% | 0.031% |
| 1999 | 35.000 | 40.000% | 0.352% | 0.042% |
| 2000 | 41.000 | 17.143% | 0.391% | 0.047% |
| 2001 | 46.000 | 12.195% | 0.430% | 0.052% |
| 2002 | 80.000 | 73.913% | 0.688% | 0.088% |
| 2003 | 95.000 | 18.750% | 0.779% | 0.101% |
| 2004 | 106.000 | 11.579% | 0.828% | 0.109% |
| 2005 | 141.000 | 33.019% | 1.026% | 0.142% |
| 2006 | 201.000 | 42.553% | 1.324% | 0.197% |
| 2007 | 208.000 | 3.483% | 1.228% | 0.197% |
| 2008 | 246.000 | 18.269% | 1.399% | 0.225% |
| 2009 | 250.000 | 1.626% | 1.350% | 0.237% |
| 2010 | 290.000 | 16.000% | 1.401% | 0.255% |
| 2011 | 272.000 | -6.207% | 1.226% | 0.232% |
| 2012 | 297.000 | 9.191% | 1.280% | 0.246% |
| 2013 | 303.000 | 2.020% | 1.266% | 0.247% |
| 2014 | 317.000 | 4.620% | 1.281% | 0.258% |
Historical Energy Data about Vietnam
Total Oil Supply
Total Consumption of Petroleum Products
Oil and Petroleum Products, Net Exports/Imports (-)
Production of Crude Oil including Lease Condensate
Crude Oil Proved Reserves
Dry Natural Gas Production
Dry Natural Gas Consumption
Dry Natural Gas, Net Exports/Imports (-)
Proved Reserves of Natural Gas
Total Primary Coal Production
Total Coal Consumption
Coal, Net Exports/Imports (-)
Total Recoverable Coal
Total Electricity Net Generation
Total Electricity Net Consumption
Electricity, Net Exports/Imports (-)
Total Conventional Thermal Electricity Net Generation
Hydroelectricity Net Generation
Total Primary Energy Production
Total Primary Energy Consumption
Total Carbon Dioxide Emissions from the Consumption of Energy
Population