| Business / Energy Data |
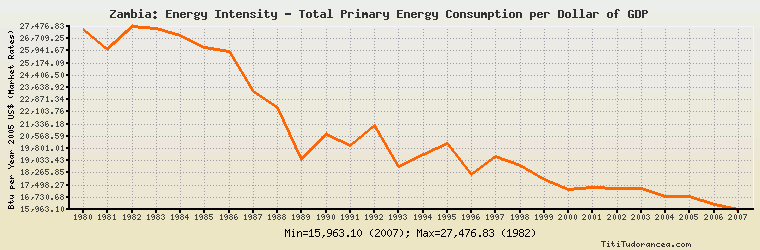
Zambia: Energy Intensity - Total Primary Energy Consumption per Dollar of GDP
Btu per Year 2005 U.S. Dollars (Market Exchange Rates)
| Year | Zambia | Change, percent | Zambia, percent of Africa | Zambia, percent of World |
| 1980 | 27,309.076 | N/A | 205.250% | N/A |
| 1981 | 26,019.899 | -4.721% | 189.967% | N/A |
| 1982 | 27,476.832 | 5.599% | 187.435% | N/A |
| 1983 | 27,365.505 | -0.405% | 179.430% | N/A |
| 1984 | 26,880.011 | -1.774% | 172.882% | N/A |
| 1985 | 26,185.432 | -2.584% | 169.632% | N/A |
| 1986 | 25,915.204 | -1.032% | 166.396% | N/A |
| 1987 | 23,381.006 | -9.779% | 148.587% | N/A |
| 1988 | 22,406.520 | -4.168% | 143.316% | N/A |
| 1989 | 19,108.795 | -14.718% | 126.824% | N/A |
| 1990 | 20,708.369 | 8.371% | 135.366% | N/A |
| 1991 | 19,990.548 | -3.466% | 128.420% | 175.596% |
| 1992 | 21,246.423 | 6.282% | 135.241% | 189.906% |
| 1993 | 18,683.090 | -12.065% | 119.076% | 167.358% |
| 1994 | 19,428.203 | 3.988% | 121.527% | 177.335% |
| 1995 | 20,138.411 | 3.656% | 125.725% | 185.111% |
| 1996 | 18,175.213 | -9.749% | 116.496% | 168.069% |
| 1997 | 19,275.961 | 6.056% | 122.285% | 182.053% |
| 1998 | 18,740.537 | -2.778% | 120.249% | 180.559% |
| 1999 | 17,819.825 | -4.913% | 113.760% | 174.142% |
| 2000 | 17,235.055 | -3.282% | 109.889% | 172.113% |
| 2001 | 17,366.932 | 0.765% | 109.155% | 174.905% |
| 2002 | 17,307.965 | -0.340% | 111.731% | 173.440% |
| 2003 | 17,292.445 | -0.090% | 111.780% | 171.552% |
| 2004 | 16,757.265 | -3.095% | 109.092% | 163.989% |
| 2005 | 16,770.562 | 0.079% | 111.103% | 164.911% |
| 2006 | 16,282.017 | -2.913% | 112.479% | 162.901% |
| 2007 | 15,963.101 | -1.959% | 118.387% | 167.469% |
| 2008 | N/A | N/A | N/A | N/A |
| 2009 | N/A | N/A | N/A | N/A |
| 2010 | N/A | N/A | N/A | N/A |
Historical Energy Data about Zambia
Total Oil Supply
Total Consumption of Petroleum Products
Oil and Petroleum Products, Net Exports/Imports (-)
Dry Natural Gas, Net Exports/Imports (-)
Total Primary Coal Production
Total Coal Consumption
Coal, Net Exports/Imports (-)
Total Recoverable Coal
Total Electricity Net Generation
Total Electricity Net Consumption
Total Electricity Exports
Total Electricity Imports
Electricity, Net Exports/Imports (-)
Total Conventional Thermal Electricity Net Generation
Hydroelectricity Net Generation
Total Primary Energy Production
Total Primary Energy Consumption
Total Carbon Dioxide Emissions from the Consumption of Energy
Population