| Business / Energy Data |
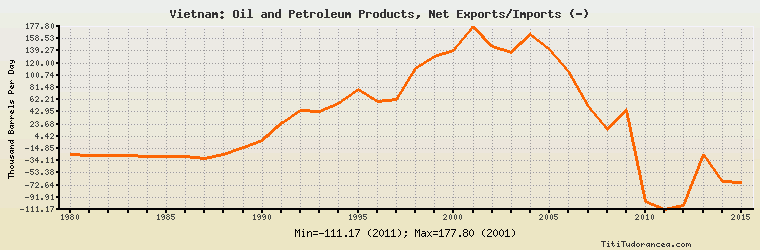
Vietnam: Oil and Petroleum Products, Net Exports/Imports (-)
Thousand Barrels Per Day
| Year | Vietnam | Change, percent | Vietnam, percent of Asia & Oceania | Vietnam, percent of World |
| 1980 | -24.000 | N/A | 0.428% | N/A |
| 1981 | -26.400 | 10.000% | 0.473% | N/A |
| 1982 | -26.000 | -1.515% | 0.474% | N/A |
| 1983 | -26.600 | 2.308% | 0.521% | N/A |
| 1984 | -27.000 | 1.504% | 0.529% | N/A |
| 1985 | -27.883 | 3.270% | 0.590% | N/A |
| 1986 | -28.200 | 1.137% | 0.573% | N/A |
| 1987 | -30.000 | 6.383% | 0.565% | N/A |
| 1988 | -25.000 | -16.667% | 0.414% | N/A |
| 1989 | -14.000 | -44.000% | 0.212% | N/A |
| 1990 | -3.000 | -78.571% | 0.042% | N/A |
| 1991 | 24.000 | -900.000% | -0.321% | N/A |
| 1992 | 45.000 | 87.500% | -0.544% | N/A |
| 1993 | 43.000 | -4.444% | -0.479% | N/A |
| 1994 | 56.000 | 30.233% | -0.569% | N/A |
| 1995 | 79.000 | 41.071% | -0.760% | N/A |
| 1996 | 59.000 | -25.316% | -0.536% | N/A |
| 1997 | 62.000 | 5.085% | -0.536% | N/A |
| 1998 | 111.000 | 79.032% | -0.990% | N/A |
| 1999 | 131.000 | 18.018% | -1.076% | N/A |
| 2000 | 140.000 | 6.870% | -1.119% | N/A |
| 2001 | 177.799 | 26.999% | -1.402% | N/A |
| 2002 | 146.595 | -17.550% | -1.111% | N/A |
| 2003 | 137.507 | -6.199% | -0.967% | N/A |
| 2004 | 165.287 | 20.203% | -1.067% | N/A |
| 2005 | 141.392 | -14.457% | -0.895% | N/A |
| 2006 | 106.759 | -24.494% | -0.655% | N/A |
| 2007 | 51.732 | -51.543% | -0.307% | N/A |
| 2008 | 14.762 | -71.464% | -0.089% | N/A |
| 2009 | 44.588 | 202.046% | -0.258% | N/A |
| 2010 | -98.721 | -321.407% | 0.529% | N/A |
| 2011 | -111.173 | 12.613% | 0.569% | N/A |
| 2012 | -104.785 | -5.746% | 0.510% | N/A |
| 2013 | -24.754 | -76.376% | 0.116% | N/A |
| 2014 | -67.004 | 170.679% | 0.311% | N/A |
| 2015 | -69.305 | 3.434% | 0.307% | N/A |
Historical Energy Data about Vietnam
Total Oil Supply
Total Consumption of Petroleum Products
Oil and Petroleum Products, Net Exports/Imports (-)
Production of Crude Oil including Lease Condensate
Crude Oil Proved Reserves
Dry Natural Gas Production
Dry Natural Gas Consumption
Dry Natural Gas, Net Exports/Imports (-)
Proved Reserves of Natural Gas
Total Primary Coal Production
Total Coal Consumption
Coal, Net Exports/Imports (-)
Total Recoverable Coal
Total Electricity Net Generation
Total Electricity Net Consumption
Electricity, Net Exports/Imports (-)
Total Conventional Thermal Electricity Net Generation
Hydroelectricity Net Generation
Total Primary Energy Production
Total Primary Energy Consumption
Total Carbon Dioxide Emissions from the Consumption of Energy
Population