| News / Science News |
Is the Global Crisis Triggering Basic Instincts?
A Study on European Population Growth Rates
BOGDAN FLORIN PAUL | SEPTEMBER 29, 2009
Frustration and economic uncertainty related to the start of the worldwide crisis may have had unexpected results. You could say that people were returning to traditional family values, or that the crisis has been triggering obscure survival instincts of the species, but not matter how you call it, a new trend is showing in European demographic data.
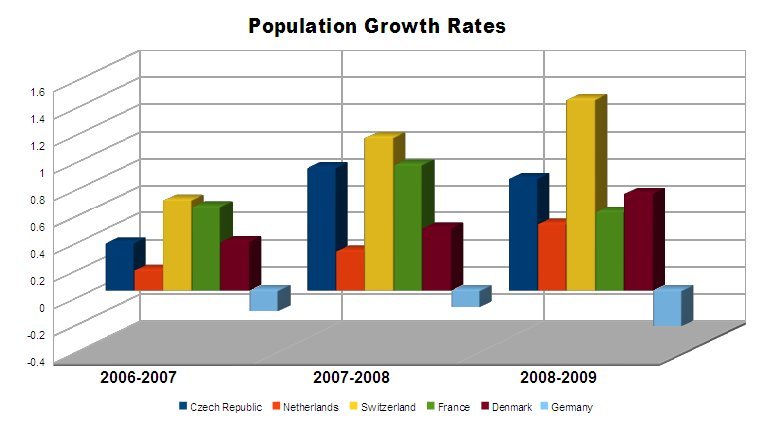
Population Growth Rates in The Czech Republic, Netherlands, Switzerland, France, Germany and Turkey.
In 2007-2008, the population growth rate (PGR) of the Czech Republic almost tripled, that of the Netherlands doubled, while the Swiss and the French rates showed solid increases, from 0.67% to 1.13% and from 0.62% to 0.93%, respectively. Not to mention Turkey, where the population growth rate jumped from -3.9% in 2006-2007 to +1.29% in 2007-2008. Even in Germany, a country experiencing negative growth rates over the last six years, the decrease rate slowed down in 2007-2008, from -0.15% to -0.12%.
The trend changed in some countries when the crisis got deeper, but population growth remained solid in others.
In 2008-2009 the PGR slid in Germany, France and in the Czech Republic but population growth continued in the Netherlands and Switzerland.
In Denmark the rate increased from 0.36% in 2006-2007 to 0.46% in 2007-2008 and jumped to 0.72% in 2008-2009.
Estonia has a negative growth rate but the decrease is slowing down. The figures have been constantly improving over the last ten years, from -0.99% in 1998-1999 to -0.42% in 2001-2002, -0.17% in 2006-2007, -0.11% in 2007-2008 and -0.04% in 2008-2009.
In Spain, the rate has been above 1 since 2001. PGR increased from 1.64% in 2006-2007 to 1.82% in 2007-2008, but fell to 1.2 in 2008-2009. Spain's best years in terms of population growth over the last decade were 1999, (when PGR rose from 0.41% to 0.62%), 2000 (from 0.62% to 1.07%) and 2002 (from 1.2% to 1.71%).
Italy's PGR has increased too, from 0.65% in 2006-2007 to 0.83% in 2007-2008 but fell back to 0.73% in 2008-2009. The last few years were good in terms of population growth in Italy, with PGR surging to 0.99% in both 2003 and 2004, falling back to 0.49% in 2005 and rising again in 2006-2007, but the turning point was 2002-2003, when official figures increased nine times, surging from 0.06% at 01.01.2002 to 0.57% at 01.01.2003. As in Spain, the rate was affected by incoming workforce migration from Eastern Europe.
In Norway, PGR has increased from 0.88% in 2006-2007 to 1.2% in 2007-2008 and continued to grow in 2008-2009, reaching 1.31% on January 1, 2009.
In Sweden, population is growing too, but this may have nothing to do with the crisis. PGR figures were 0.72% in 2006-2007, 0.76% in 2007-2008 and 0.8% in 2008-2009. The turning points were 1999-2000, when PGR surged from 0.08% to 0.24% (a threefold increase) and 2005-2006, when PGR jumped from 0.4% to 0.72%.
But the population growth trend is not affecting all European countries. In fact, we see the exact opposite in countries like Ireland, Cyprus, Portugal and Iceland.
In the UK, Austria, Greece, Malta, Slovenia and Liechtenstein population growth rates declined in 2007 but have made a comeback in 2008.
Countries like Romania, Poland and Bulgaria experienced massive workforce migration to Western European countries and they are showing negative population growth rates over most of the last decade. In 2001-2002, when West-European entry visas for Romanian nationals were waived, the Romanian PGR dropped from -0.11% to a dramatic -2.66%. A similar process occurred the same year in Bulgaria, PGR dropping from -0.51% to -3.17%, and one year earlier in Poland, where PGR dropped from -0.03% in 2000 to -1.03% in 2001. However, 2007-2009 figures show a gradual recovery and the crisis may have helped population growth rates in these countries.
Negative growth rates are also occurring in Hungary and Croatia, but the decrease rate slowed down in 2008-2009 compared to 2007-2008.
Population Growth Rates, 2007-2009
| 01.01.2007 | 01.01.2008 | 01.01.2009 | ||||
| population | growth rate (%) | population | growth rate (%) | population | growth rate (%) | |
| Austria | 8298923 | 0.40 | 8318592 | 0.24 | 8355260 | 0.44 |
| Belgium | 10584534 | 0.70 | 10666866 | 0.78 | 10754528 | 0.82 |
| Bulgaria | 7679290 | -0.51 | 7640238 | -0.51 | 7606551 | -0.44 |
| Croatia | 4441238 | -0.04 | 4436401 | -0.11 | 4435056 | -0.03 |
| Cyprus | 778684 | 1.60 | 789269 | 1.36 | 793963 | 0.59 |
| Czech Republic | 10287189 | 0.35 | 10381130 | 0.91 | 10467542 | 0.83 |
| Denmark | 5447084 | 0.36 | 5472093 | 0.46 | 5511451 | 0.72 |
| Estonia | 1342409 | -0.17 | 1340935 | -0.11 | 1340415 | -0.04 |
| Finland | 5276955 | 0.41 | 5300484 | 0.45 | 5326314 | 0.49 |
| France | 63392140 | 0.62 | 63983000 | 0.93 | 64351000 | 0.58 |
| Germany | 82314906 | -0.15 | 82217837 | -0.12 | 82002356 | -0.26 |
| Greece | 11171740 | 0.42 | 11213785 | 0.38 | 11257285 | 0.39 |
| Hungary | 10066158 | -0.10 | 10045401 | -0.21 | 10031208 | -0.14 |
| Iceland | 307672 | 2.59 | 315459 | 2.53 | 319368 | 1.24 |
| Ireland | 4312526 | 2.46 | 4401335 | 2.06 | 4465540 | 1.46 |
| Italy | 59131287 | 0.65 | 59619290 | 0.83 | 60053442 | 0.73 |
| Latvia | 2281305 | -0.58 | 2270894 | -0.46 | 2261294 | -0.42 |
| Liechtenstein | 35168 | 0.75 | 35356 | 0.53 | 35590 | 0.66 |
| Lithuania | 3384879 | -0.54 | 3366357 | -0.55 | 3349872 | -0.49 |
| Luxembourg | 476187 | 1.51 | 483799 | 1.60 | 493500 | 2.01 |
| Macedonia | 2041941 | 0.17 | 2045177 | 0.16 | 2048620 | 0.17 |
| Malta | 407810 | 0.69 | 410290 | 0.61 | 413627 | 0.81 |
| Netherlands | 16357992 | 0.15 | 16405399 | 0.29 | 16486587 | 0.49 |
| Norway | 4681134 | 0.88 | 4737171 | 1.20 | 4799252 | 1.31 |
| Poland | 38125479 | -0.08 | 38115641 | -0.03 | 38135876 | 0.05 |
| Portugal | 10599095 | 0.28 | 10617575 | 0.17 | 10627250 | 0.09 |
| Romania | 21565119 | -0.21 | 21528627 | -0.17 | 21498616 | -0.14 |
| Slovakia | 5393637 | 0.08 | 5400998 | 0.14 | 5412254 | 0.21 |
| Slovenia | 2010377 | 0.35 | 2010269 | -0.01 | 2032362 | 1.1 |
| Spain | 44474631 | 1.64 | 45283259 | 1.82 | 45828172 | 1.2 |
| Sweden | 9113257 | 0.72 | 9182927 | 0.76 | 9256347 | 0.8 |
| Switzerland | 7508739 | 0.67 | 7593494 | 1.13 | 7700202 | 1.41 |
| Turkey | 69689256 | -3.90 | 70586256 | 1.29 | 71517100 | 1.32 |
| United Kingdom | 60816701 | 0.70 | 61193524 | 0.62 | 61634599 | 0.72 |
Note: This study was based on January 1st population data per country. Annual population change and population growth rates were derived from Eurostat yearly population data. The information we have used for this study is available for download in Excel spreadsheet format here: pgr_trends.xls. For an in-depth research in European demographics we encourage you to download this spreadsheet.
YOU MAY ALSO LIKE


