| Business / Energy Data |
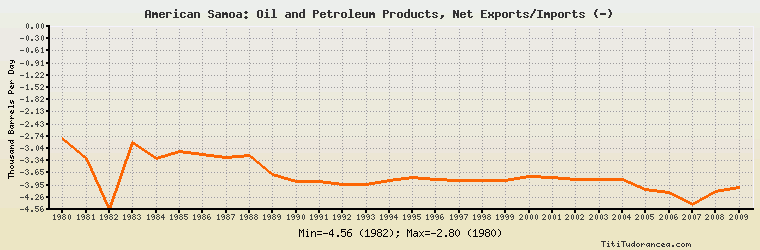
American Samoa: Oil and Petroleum Products, Net Exports/Imports (-)
Thousand Barrels Per Day
| Year | American Samoa | Change, percent | American Samoa, percent of Asia & Oceania | American Samoa, percent of World |
| 1980 | -2.800 | N/A | 0.050% | N/A |
| 1981 | -3.290 | 17.500% | 0.059% | N/A |
| 1982 | -4.560 | 38.602% | 0.083% | N/A |
| 1983 | -2.890 | -36.623% | 0.057% | N/A |
| 1984 | -3.300 | 14.187% | 0.065% | N/A |
| 1985 | -3.107 | -5.848% | 0.066% | N/A |
| 1986 | -3.196 | 2.864% | 0.065% | N/A |
| 1987 | -3.258 | 1.940% | 0.061% | N/A |
| 1988 | -3.208 | -1.535% | 0.053% | N/A |
| 1989 | -3.697 | 15.243% | 0.056% | N/A |
| 1990 | -3.852 | 4.193% | 0.055% | N/A |
| 1991 | -3.852 | 0.000% | 0.051% | N/A |
| 1992 | -3.944 | 2.388% | 0.048% | N/A |
| 1993 | -3.933 | -0.279% | 0.044% | N/A |
| 1994 | -3.830 | -2.619% | 0.039% | N/A |
| 1995 | -3.770 | -1.567% | 0.036% | N/A |
| 1996 | -3.822 | 1.379% | 0.035% | N/A |
| 1997 | -3.833 | 0.288% | 0.033% | N/A |
| 1998 | -3.833 | 0.000% | 0.034% | N/A |
| 1999 | -3.833 | 0.000% | 0.031% | N/A |
| 2000 | -3.744 | -2.322% | 0.030% | N/A |
| 2001 | -3.754 | 0.267% | 0.030% | N/A |
| 2002 | -3.817 | 1.678% | 0.029% | N/A |
| 2003 | -3.817 | 0.000% | 0.027% | N/A |
| 2004 | -3.807 | -0.262% | 0.025% | N/A |
| 2005 | -4.066 | 6.803% | 0.026% | N/A |
| 2006 | -4.140 | 1.820% | 0.025% | N/A |
| 2007 | -4.440 | 7.246% | 0.026% | N/A |
| 2008 | -4.100 | -7.658% | 0.025% | N/A |
| 2009 | -4.000 | -2.439% | 0.023% | N/A |
Historical Energy Data about American Samoa
Total Consumption of Petroleum Products
Oil and Petroleum Products, Net Exports/Imports (-)
Dry Natural Gas, Net Exports/Imports (-)
Coal, Net Exports/Imports (-)
Total Electricity Net Generation
Total Electricity Net Consumption
Electricity, Net Exports/Imports (-)
Total Conventional Thermal Electricity Net Generation
Total Primary Energy Consumption
Total Carbon Dioxide Emissions from the Consumption of Energy
Population