| Business / Energy Data |
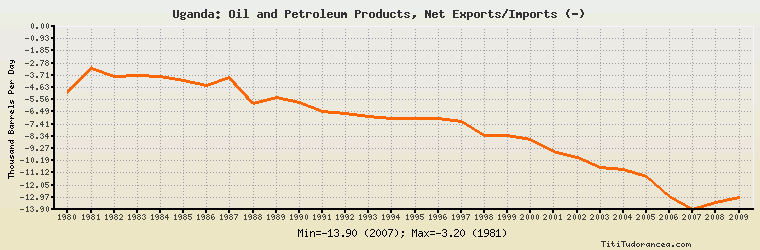
Uganda: Oil and Petroleum Products, Net Exports/Imports (-)
Thousand Barrels Per Day
| Year | Uganda | Change, percent | Uganda, percent of Africa | Uganda, percent of World |
| 1980 | -5.000 | N/A | -0.105% | N/A |
| 1981 | -3.200 | -36.000% | -0.097% | N/A |
| 1982 | -3.800 | 18.750% | -0.118% | N/A |
| 1983 | -3.700 | -2.632% | -0.115% | N/A |
| 1984 | -3.800 | 2.703% | -0.106% | N/A |
| 1985 | -4.100 | 7.895% | -0.109% | N/A |
| 1986 | -4.496 | 9.659% | -0.121% | N/A |
| 1987 | -3.853 | -14.302% | -0.105% | N/A |
| 1988 | -5.876 | 52.505% | -0.149% | N/A |
| 1989 | -5.412 | -7.897% | -0.127% | N/A |
| 1990 | -5.787 | 6.929% | -0.124% | N/A |
| 1991 | -6.450 | 11.457% | -0.133% | N/A |
| 1992 | -6.588 | 2.140% | -0.134% | N/A |
| 1993 | -6.844 | 3.886% | -0.141% | N/A |
| 1994 | -7.015 | 2.499% | -0.145% | N/A |
| 1995 | -7.014 | -0.014% | -0.138% | N/A |
| 1996 | -6.968 | -0.656% | -0.134% | N/A |
| 1997 | -7.187 | 3.143% | -0.132% | N/A |
| 1998 | -8.290 | 15.347% | -0.154% | N/A |
| 1999 | -8.290 | 0.000% | -0.157% | N/A |
| 2000 | -8.561 | 3.269% | -0.158% | N/A |
| 2001 | -9.522 | 11.225% | -0.176% | N/A |
| 2002 | -9.930 | 4.285% | -0.183% | N/A |
| 2003 | -10.687 | 7.623% | -0.183% | N/A |
| 2004 | -10.874 | 1.750% | -0.168% | N/A |
| 2005 | -11.390 | 4.745% | -0.160% | N/A |
| 2006 | -12.879 | 13.073% | -0.179% | N/A |
| 2007 | -13.900 | 7.928% | -0.187% | N/A |
| 2008 | -13.400 | -3.597% | -0.181% | N/A |
| 2009 | -13.000 | -2.985% | -0.183% | N/A |
Historical Energy Data about Uganda
Total Consumption of Petroleum Products
Oil and Petroleum Products, Net Exports/Imports (-)
Dry Natural Gas, Net Exports/Imports (-)
Coal, Net Exports/Imports (-)
Total Electricity Net Generation
Total Electricity Net Consumption
Total Electricity Exports
Total Electricity Imports
Electricity, Net Exports/Imports (-)
Total Conventional Thermal Electricity Net Generation
Hydroelectricity Net Generation
Total Primary Energy Production
Total Primary Energy Consumption
Total Carbon Dioxide Emissions from the Consumption of Energy
Population