| Business / Energy Data |
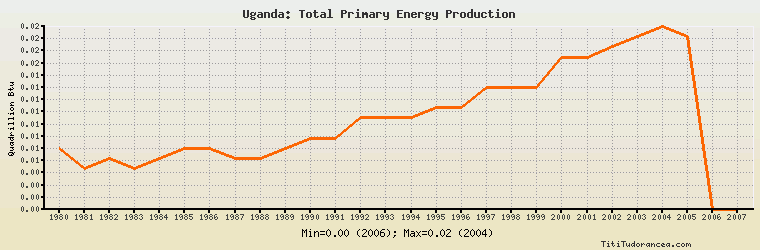
Uganda: Total Primary Energy Production
Quadrillion Btu
| Year | Uganda | Change, percent | Uganda, percent of Africa | Uganda, percent of World |
| 1980 | 0.007 | N/A | 0.041% | 0.002% |
| 1981 | 0.005 | -28.571% | 0.034% | 0.002% |
| 1982 | 0.006 | 20.000% | 0.040% | 0.002% |
| 1983 | 0.005 | -16.667% | 0.032% | 0.002% |
| 1984 | 0.006 | 20.000% | 0.035% | 0.002% |
| 1985 | 0.007 | 16.667% | 0.039% | 0.002% |
| 1986 | 0.007 | 0.000% | 0.039% | 0.002% |
| 1987 | 0.006 | -14.286% | 0.033% | 0.002% |
| 1988 | 0.006 | 0.000% | 0.031% | 0.002% |
| 1989 | 0.007 | 16.667% | 0.035% | 0.002% |
| 1990 | 0.008 | 14.286% | 0.038% | 0.002% |
| 1991 | 0.008 | 0.000% | 0.036% | 0.002% |
| 1992 | 0.010 | 25.000% | 0.045% | 0.003% |
| 1993 | 0.010 | 0.000% | 0.045% | 0.003% |
| 1994 | 0.010 | 0.000% | 0.045% | 0.003% |
| 1995 | 0.011 | 10.000% | 0.047% | 0.003% |
| 1996 | 0.011 | 0.000% | 0.046% | 0.003% |
| 1997 | 0.013 | 18.182% | 0.051% | 0.003% |
| 1998 | 0.013 | 0.000% | 0.051% | 0.003% |
| 1999 | 0.013 | 0.000% | 0.050% | 0.003% |
| 2000 | 0.016 | 23.077% | 0.059% | 0.004% |
| 2001 | 0.016 | 0.000% | 0.059% | 0.004% |
| 2002 | 0.017 | 6.250% | 0.062% | 0.004% |
| 2003 | 0.018 | 5.882% | 0.062% | 0.004% |
| 2004 | 0.019 | 5.556% | 0.061% | 0.004% |
| 2005 | 0.018 | -5.263% | 0.055% | 0.004% |
| 2006 | 0.001 | -94.444% | 0.003% | 0.000% |
| 2007 | 0.001 | 0.000% | 0.003% | 0.000% |
| 2008 | N/A | N/A | N/A | N/A |
| 2009 | N/A | N/A | N/A | N/A |
| 2010 | N/A | N/A | N/A | N/A |
Historical Energy Data about Uganda
Total Consumption of Petroleum Products
Oil and Petroleum Products, Net Exports/Imports (-)
Dry Natural Gas, Net Exports/Imports (-)
Coal, Net Exports/Imports (-)
Total Electricity Net Generation
Total Electricity Net Consumption
Total Electricity Exports
Total Electricity Imports
Electricity, Net Exports/Imports (-)
Total Conventional Thermal Electricity Net Generation
Hydroelectricity Net Generation
Total Primary Energy Production
Total Primary Energy Consumption
Total Carbon Dioxide Emissions from the Consumption of Energy
Population