| Business / Energy Data |
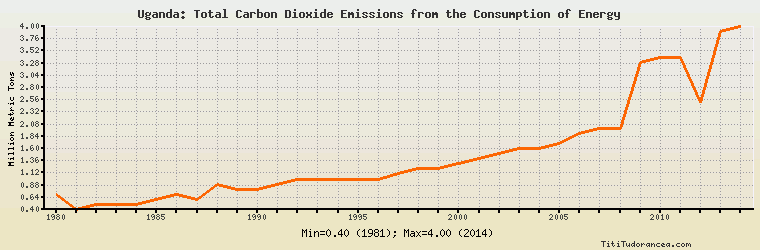
Uganda: Total Carbon Dioxide Emissions from the Consumption of Energy
Million Metric Tons
| Year | Uganda | Change, percent | Uganda, percent of Africa | Uganda, percent of World |
| 1980 | 0.702 | N/A | 0.134% | 0.004% |
| 1981 | 0.400 | -43.020% | 0.077% | 0.002% |
| 1982 | 0.500 | 25.000% | 0.090% | 0.003% |
| 1983 | 0.500 | 0.000% | 0.085% | 0.003% |
| 1984 | 0.500 | 0.000% | 0.081% | 0.003% |
| 1985 | 0.600 | 20.000% | 0.095% | 0.003% |
| 1986 | 0.700 | 16.667% | 0.108% | 0.004% |
| 1987 | 0.600 | -14.286% | 0.090% | 0.003% |
| 1988 | 0.900 | 50.000% | 0.132% | 0.004% |
| 1989 | 0.800 | -11.111% | 0.113% | 0.004% |
| 1990 | 0.800 | 0.000% | 0.108% | 0.004% |
| 1991 | 0.900 | 12.500% | 0.121% | 0.004% |
| 1992 | 1.000 | 11.111% | 0.134% | 0.005% |
| 1993 | 1.000 | 0.000% | 0.129% | 0.005% |
| 1994 | 1.000 | 0.000% | 0.127% | 0.005% |
| 1995 | 1.000 | 0.000% | 0.122% | 0.005% |
| 1996 | 1.000 | 0.000% | 0.118% | 0.004% |
| 1997 | 1.100 | 10.000% | 0.129% | 0.005% |
| 1998 | 1.200 | 9.091% | 0.138% | 0.005% |
| 1999 | 1.200 | 0.000% | 0.139% | 0.005% |
| 2000 | 1.300 | 8.333% | 0.148% | 0.005% |
| 2001 | 1.400 | 7.692% | 0.157% | 0.006% |
| 2002 | 1.500 | 7.143% | 0.162% | 0.006% |
| 2003 | 1.600 | 6.667% | 0.166% | 0.006% |
| 2004 | 1.600 | 0.000% | 0.160% | 0.006% |
| 2005 | 1.700 | 6.250% | 0.164% | 0.006% |
| 2006 | 1.900 | 11.765% | 0.181% | 0.007% |
| 2007 | 2.000 | 5.263% | 0.185% | 0.007% |
| 2008 | 2.000 | 0.000% | 0.178% | 0.007% |
| 2009 | 3.300 | 65.000% | 0.301% | 0.011% |
| 2010 | 3.400 | 3.030% | 0.295% | 0.011% |
| 2011 | 3.400 | 0.000% | 0.298% | 0.011% |
| 2012 | 2.500 | -26.471% | 0.208% | 0.008% |
| 2013 | 3.900 | 56.000% | 0.316% | 0.012% |
| 2014 | 4.000 | 2.564% | 0.315% | 0.012% |
Historical Energy Data about Uganda
Total Consumption of Petroleum Products
Oil and Petroleum Products, Net Exports/Imports (-)
Dry Natural Gas, Net Exports/Imports (-)
Coal, Net Exports/Imports (-)
Total Electricity Net Generation
Total Electricity Net Consumption
Total Electricity Exports
Total Electricity Imports
Electricity, Net Exports/Imports (-)
Total Conventional Thermal Electricity Net Generation
Hydroelectricity Net Generation
Total Primary Energy Production
Total Primary Energy Consumption
Total Carbon Dioxide Emissions from the Consumption of Energy
Population