| Business / Energy Data |
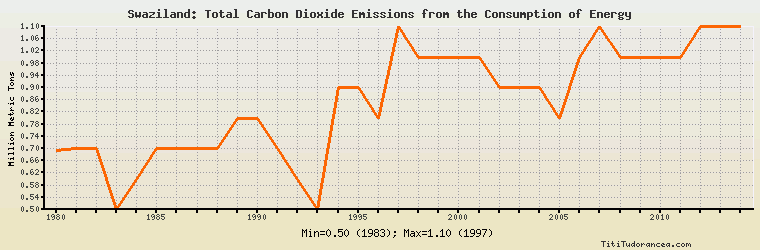
Swaziland: Total Carbon Dioxide Emissions from the Consumption of Energy
Million Metric Tons
| Year | Swaziland | Change, percent | Swaziland, percent of Africa | Swaziland, percent of World |
| 1980 | 0.692 | N/A | 0.132% | 0.004% |
| 1981 | 0.700 | 1.156% | 0.135% | 0.004% |
| 1982 | 0.700 | 0.000% | 0.126% | 0.004% |
| 1983 | 0.500 | -28.571% | 0.085% | 0.003% |
| 1984 | 0.600 | 20.000% | 0.098% | 0.003% |
| 1985 | 0.700 | 16.667% | 0.111% | 0.004% |
| 1986 | 0.700 | 0.000% | 0.108% | 0.004% |
| 1987 | 0.700 | 0.000% | 0.105% | 0.003% |
| 1988 | 0.700 | 0.000% | 0.102% | 0.003% |
| 1989 | 0.800 | 14.286% | 0.113% | 0.004% |
| 1990 | 0.800 | 0.000% | 0.108% | 0.004% |
| 1991 | 0.700 | -12.500% | 0.094% | 0.003% |
| 1992 | 0.600 | -14.286% | 0.080% | 0.003% |
| 1993 | 0.500 | -16.667% | 0.065% | 0.002% |
| 1994 | 0.900 | 80.000% | 0.114% | 0.004% |
| 1995 | 0.900 | 0.000% | 0.110% | 0.004% |
| 1996 | 0.800 | -11.111% | 0.095% | 0.004% |
| 1997 | 1.100 | 37.500% | 0.129% | 0.005% |
| 1998 | 1.000 | -9.091% | 0.115% | 0.004% |
| 1999 | 1.000 | 0.000% | 0.116% | 0.004% |
| 2000 | 1.000 | 0.000% | 0.114% | 0.004% |
| 2001 | 1.000 | 0.000% | 0.112% | 0.004% |
| 2002 | 0.900 | -10.000% | 0.097% | 0.004% |
| 2003 | 0.900 | 0.000% | 0.093% | 0.004% |
| 2004 | 0.900 | 0.000% | 0.090% | 0.003% |
| 2005 | 0.800 | -11.111% | 0.077% | 0.003% |
| 2006 | 1.000 | 25.000% | 0.095% | 0.003% |
| 2007 | 1.100 | 10.000% | 0.102% | 0.004% |
| 2008 | 1.000 | -9.091% | 0.089% | 0.003% |
| 2009 | 1.000 | 0.000% | 0.091% | 0.003% |
| 2010 | 1.000 | 0.000% | 0.087% | 0.003% |
| 2011 | 1.000 | 0.000% | 0.088% | 0.003% |
| 2012 | 1.100 | 10.000% | 0.092% | 0.003% |
| 2013 | 1.100 | 0.000% | 0.089% | 0.003% |
| 2014 | 1.100 | 0.000% | 0.087% | 0.003% |
Historical Energy Data about Swaziland
Total Consumption of Petroleum Products
Oil and Petroleum Products, Net Exports/Imports (-)
Dry Natural Gas, Net Exports/Imports (-)
Total Primary Coal Production
Total Coal Consumption
Coal, Net Exports/Imports (-)
Total Recoverable Coal
Total Electricity Net Generation
Total Electricity Net Consumption
Total Electricity Imports
Electricity, Net Exports/Imports (-)
Total Conventional Thermal Electricity Net Generation
Hydroelectricity Net Generation
Total Primary Energy Production
Total Primary Energy Consumption
Total Carbon Dioxide Emissions from the Consumption of Energy
Population