| Business / Energy Data |
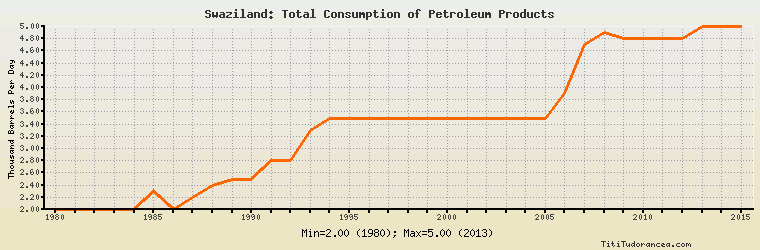
Swaziland: Total Consumption of Petroleum Products
Thousand Barrels Per Day
| Year | Swaziland | Change, percent | Swaziland, percent of Africa | Swaziland, percent of World |
| 1980 | 2.000 | N/A | 0.136% | 0.003% |
| 1981 | 2.000 | 0.000% | 0.127% | 0.003% |
| 1982 | 2.000 | 0.000% | 0.121% | 0.003% |
| 1983 | 2.000 | 0.000% | 0.118% | 0.003% |
| 1984 | 2.000 | 0.000% | 0.114% | 0.003% |
| 1985 | 2.300 | 15.000% | 0.126% | 0.004% |
| 1986 | 2.000 | -13.043% | 0.110% | 0.003% |
| 1987 | 2.200 | 10.000% | 0.120% | 0.003% |
| 1988 | 2.400 | 9.091% | 0.126% | 0.004% |
| 1989 | 2.500 | 4.167% | 0.126% | 0.004% |
| 1990 | 2.500 | 0.000% | 0.121% | 0.004% |
| 1991 | 2.800 | 12.000% | 0.132% | 0.004% |
| 1992 | 2.800 | 0.000% | 0.130% | 0.004% |
| 1993 | 3.300 | 17.857% | 0.152% | 0.005% |
| 1994 | 3.500 | 6.061% | 0.160% | 0.005% |
| 1995 | 3.500 | 0.000% | 0.155% | 0.005% |
| 1996 | 3.500 | 0.000% | 0.152% | 0.005% |
| 1997 | 3.500 | 0.000% | 0.148% | 0.005% |
| 1998 | 3.500 | 0.000% | 0.146% | 0.005% |
| 1999 | 3.500 | 0.000% | 0.143% | 0.005% |
| 2000 | 3.500 | 0.000% | 0.137% | 0.005% |
| 2001 | 3.500 | 0.000% | 0.134% | 0.005% |
| 2002 | 3.500 | 0.000% | 0.129% | 0.004% |
| 2003 | 3.500 | 0.000% | 0.127% | 0.004% |
| 2004 | 3.500 | 0.000% | 0.123% | 0.004% |
| 2005 | 3.500 | 0.000% | 0.118% | 0.004% |
| 2006 | 3.900 | 11.429% | 0.130% | 0.005% |
| 2007 | 4.700 | 20.513% | 0.154% | 0.005% |
| 2008 | 4.900 | 4.255% | 0.154% | 0.006% |
| 2009 | 4.800 | -2.041% | 0.144% | 0.006% |
| 2010 | 4.800 | 0.000% | 0.136% | 0.005% |
| 2011 | 4.800 | 0.000% | 0.139% | 0.005% |
| 2012 | 4.800 | 0.000% | 0.132% | 0.005% |
| 2013 | 5.000 | 4.167% | 0.131% | 0.005% |
| 2014 | 5.000 | 0.000% | 0.125% | 0.005% |
| 2015 | 5.000 | 0.000% | 0.125% | 0.005% |
Historical Energy Data about Swaziland
Total Consumption of Petroleum Products
Oil and Petroleum Products, Net Exports/Imports (-)
Dry Natural Gas, Net Exports/Imports (-)
Total Primary Coal Production
Total Coal Consumption
Coal, Net Exports/Imports (-)
Total Recoverable Coal
Total Electricity Net Generation
Total Electricity Net Consumption
Total Electricity Imports
Electricity, Net Exports/Imports (-)
Total Conventional Thermal Electricity Net Generation
Hydroelectricity Net Generation
Total Primary Energy Production
Total Primary Energy Consumption
Total Carbon Dioxide Emissions from the Consumption of Energy
Population