| Business / Energy Data |
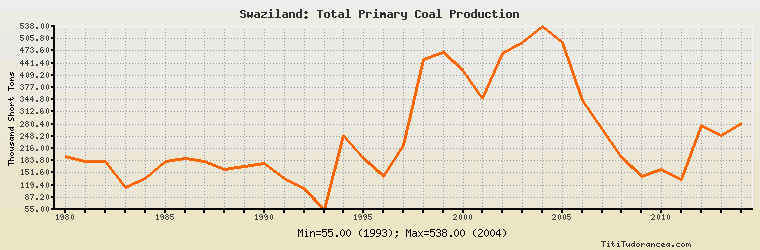
Swaziland: Total Primary Coal Production
Thousand Short Tons
| Year | Swaziland | Change, percent | Swaziland, percent of Africa | Swaziland, percent of World |
| 1980 | 194.007 | N/A | 0.147% | 0.005% |
| 1981 | 181.000 | -6.704% | 0.124% | 0.004% |
| 1982 | 181.000 | 0.000% | 0.115% | 0.004% |
| 1983 | 112.000 | -38.122% | 0.068% | 0.003% |
| 1984 | 138.000 | 23.214% | 0.075% | 0.003% |
| 1985 | 183.000 | 32.609% | 0.093% | 0.004% |
| 1986 | 190.000 | 3.825% | 0.094% | 0.004% |
| 1987 | 182.000 | -4.211% | 0.090% | 0.004% |
| 1988 | 161.000 | -11.538% | 0.078% | 0.003% |
| 1989 | 169.000 | 4.969% | 0.084% | 0.003% |
| 1990 | 176.000 | 4.142% | 0.088% | 0.003% |
| 1991 | 136.000 | -22.727% | 0.066% | 0.003% |
| 1992 | 110.000 | -19.118% | 0.055% | 0.002% |
| 1993 | 55.000 | -50.000% | 0.025% | 0.001% |
| 1994 | 251.000 | 356.364% | 0.112% | 0.005% |
| 1995 | 190.000 | -24.303% | 0.081% | 0.004% |
| 1996 | 142.000 | -25.263% | 0.061% | 0.003% |
| 1997 | 224.000 | 57.746% | 0.090% | 0.004% |
| 1998 | 452.000 | 101.786% | 0.179% | 0.009% |
| 1999 | 470.000 | 3.982% | 0.185% | 0.010% |
| 2000 | 419.000 | -10.851% | 0.165% | 0.009% |
| 2001 | 347.000 | -17.184% | 0.137% | 0.007% |
| 2002 | 467.000 | 34.582% | 0.187% | 0.009% |
| 2003 | 495.000 | 5.996% | 0.184% | 0.009% |
| 2004 | 538.000 | 8.687% | 0.197% | 0.009% |
| 2005 | 497.000 | -7.621% | 0.180% | 0.008% |
| 2006 | 342.000 | -31.187% | 0.125% | 0.005% |
| 2007 | 266.000 | -22.222% | 0.096% | 0.004% |
| 2008 | 193.000 | -27.444% | 0.068% | 0.003% |
| 2009 | 143.000 | -25.907% | 0.051% | N/A |
| 2010 | 161.000 | 12.587% | 0.056% | N/A |
| 2011 | 133.000 | -17.391% | 0.047% | N/A |
| 2012 | 276.000 | 107.519% | 0.093% | N/A |
| 2013 | 249.000 | -9.783% | 0.084% | N/A |
| 2014 | 283.000 | 13.655% | 0.092% | N/A |
Historical Energy Data about Swaziland
Total Consumption of Petroleum Products
Oil and Petroleum Products, Net Exports/Imports (-)
Dry Natural Gas, Net Exports/Imports (-)
Total Primary Coal Production
Total Coal Consumption
Coal, Net Exports/Imports (-)
Total Recoverable Coal
Total Electricity Net Generation
Total Electricity Net Consumption
Total Electricity Imports
Electricity, Net Exports/Imports (-)
Total Conventional Thermal Electricity Net Generation
Hydroelectricity Net Generation
Total Primary Energy Production
Total Primary Energy Consumption
Total Carbon Dioxide Emissions from the Consumption of Energy
Population