| Business / Energy Data |
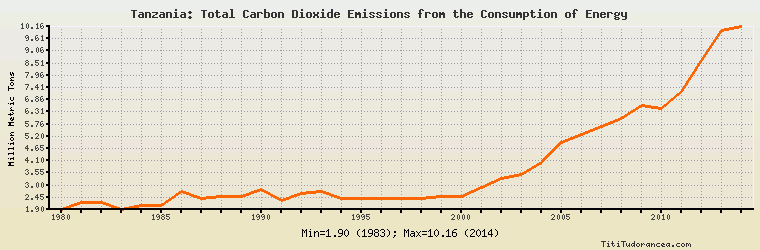
Tanzania: Total Carbon Dioxide Emissions from the Consumption of Energy
Million Metric Tons
| Year | Tanzania | Change, percent | Tanzania, percent of Africa | Tanzania, percent of World |
| 1980 | 1.912 | N/A | 0.365% | 0.010% |
| 1981 | 2.200 | 15.063% | 0.423% | 0.012% |
| 1982 | 2.200 | 0.000% | 0.395% | 0.012% |
| 1983 | 1.900 | -13.636% | 0.324% | 0.010% |
| 1984 | 2.100 | 10.526% | 0.342% | 0.011% |
| 1985 | 2.100 | 0.000% | 0.333% | 0.011% |
| 1986 | 2.700 | 28.571% | 0.415% | 0.014% |
| 1987 | 2.400 | -11.111% | 0.358% | 0.012% |
| 1988 | 2.500 | 4.167% | 0.365% | 0.012% |
| 1989 | 2.500 | 0.000% | 0.353% | 0.012% |
| 1990 | 2.800 | 12.000% | 0.379% | 0.013% |
| 1991 | 2.300 | -17.857% | 0.309% | 0.011% |
| 1992 | 2.600 | 13.043% | 0.347% | 0.012% |
| 1993 | 2.700 | 3.846% | 0.349% | 0.013% |
| 1994 | 2.400 | -11.111% | 0.305% | 0.011% |
| 1995 | 2.400 | 0.000% | 0.293% | 0.011% |
| 1996 | 2.400 | 0.000% | 0.284% | 0.011% |
| 1997 | 2.400 | 0.000% | 0.282% | 0.011% |
| 1998 | 2.400 | 0.000% | 0.277% | 0.011% |
| 1999 | 2.500 | 4.167% | 0.290% | 0.011% |
| 2000 | 2.500 | 0.000% | 0.285% | 0.011% |
| 2001 | 2.900 | 16.000% | 0.324% | 0.012% |
| 2002 | 3.300 | 13.793% | 0.357% | 0.014% |
| 2003 | 3.500 | 6.061% | 0.362% | 0.014% |
| 2004 | 4.033 | 15.229% | 0.402% | 0.015% |
| 2005 | 4.911 | 21.770% | 0.475% | 0.018% |
| 2006 | 5.265 | 7.208% | 0.500% | 0.018% |
| 2007 | 5.661 | 7.521% | 0.525% | 0.019% |
| 2008 | 6.030 | 6.518% | 0.536% | 0.020% |
| 2009 | 6.573 | 9.005% | 0.599% | 0.022% |
| 2010 | 6.439 | -2.039% | 0.558% | 0.021% |
| 2011 | 7.245 | 12.517% | 0.634% | 0.022% |
| 2012 | 8.614 | 18.896% | 0.718% | 0.026% |
| 2013 | 9.973 | 15.777% | 0.808% | 0.030% |
| 2014 | 10.161 | 1.885% | 0.801% | 0.030% |
Historical Energy Data about Tanzania
Total Oil Supply
Total Consumption of Petroleum Products
Oil and Petroleum Products, Net Exports/Imports (-)
Dry Natural Gas Production
Dry Natural Gas Consumption
Dry Natural Gas, Net Exports/Imports (-)
Proved Reserves of Natural Gas
Total Primary Coal Production
Total Coal Consumption
Coal, Net Exports/Imports (-)
Total Recoverable Coal
Total Electricity Net Generation
Total Electricity Net Consumption
Total Electricity Imports
Electricity, Net Exports/Imports (-)
Total Conventional Thermal Electricity Net Generation
Hydroelectricity Net Generation
Total Primary Energy Production
Total Primary Energy Consumption
Total Carbon Dioxide Emissions from the Consumption of Energy
Population