| Business / Energy Data |
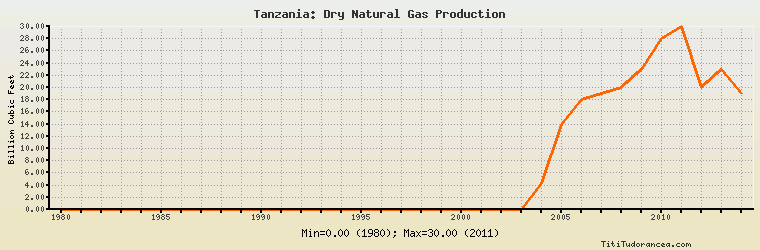
Tanzania: Dry Natural Gas Production
Billion Cubic Feet
| Year | Tanzania | Change, percent | Tanzania, percent of Africa | Tanzania, percent of World |
| 1980 | 0.000 | N/A | 0.00% | 0.00% |
| 1981 | 0.000 | 0.000% | 0.00% | 0.00% |
| 1982 | 0.000 | 0.000% | 0.00% | 0.00% |
| 1983 | 0.000 | 0.000% | 0.00% | 0.00% |
| 1984 | 0.000 | 0.000% | 0.00% | 0.00% |
| 1985 | 0.000 | 0.000% | 0.00% | 0.00% |
| 1986 | 0.000 | 0.000% | 0.00% | 0.00% |
| 1987 | 0.000 | 0.000% | 0.00% | 0.00% |
| 1988 | 0.000 | 0.000% | 0.00% | 0.00% |
| 1989 | 0.000 | 0.000% | 0.00% | 0.00% |
| 1990 | 0.000 | 0.000% | 0.00% | 0.00% |
| 1991 | 0.000 | 0.000% | 0.00% | 0.00% |
| 1992 | 0.000 | 0.000% | 0.00% | 0.00% |
| 1993 | 0.000 | 0.000% | 0.00% | 0.00% |
| 1994 | 0.000 | 0.000% | 0.00% | 0.00% |
| 1995 | 0.000 | 0.000% | 0.00% | 0.00% |
| 1996 | 0.000 | 0.000% | 0.00% | 0.00% |
| 1997 | 0.000 | 0.000% | 0.00% | 0.00% |
| 1998 | 0.000 | 0.000% | 0.00% | 0.00% |
| 1999 | 0.000 | 0.000% | 0.00% | 0.00% |
| 2000 | 0.000 | 0.000% | 0.00% | 0.00% |
| 2001 | 0.000 | 0.000% | 0.00% | 0.00% |
| 2002 | 0.000 | 0.000% | 0.00% | 0.00% |
| 2003 | 0.000 | 0.000% | 0.00% | 0.00% |
| 2004 | 4.200 | 0.000% | 0.079% | 0.004% |
| 2005 | 14.000 | 233.333% | 0.225% | 0.014% |
| 2006 | 18.000 | 28.571% | 0.274% | 0.018% |
| 2007 | 19.000 | 5.556% | 0.281% | 0.018% |
| 2008 | 20.000 | 5.263% | 0.268% | 0.019% |
| 2009 | 23.000 | 15.000% | 0.323% | 0.022% |
| 2010 | 28.000 | 21.739% | 0.380% | 0.025% |
| 2011 | 30.000 | 7.143% | 0.421% | 0.026% |
| 2012 | 20.000 | -33.333% | 0.256% | 0.017% |
| 2013 | 23.000 | 15.000% | 0.312% | 0.019% |
| 2014 | 19.000 | -17.391% | 0.258% | 0.016% |
Historical Energy Data about Tanzania
Total Oil Supply
Total Consumption of Petroleum Products
Oil and Petroleum Products, Net Exports/Imports (-)
Dry Natural Gas Production
Dry Natural Gas Consumption
Dry Natural Gas, Net Exports/Imports (-)
Proved Reserves of Natural Gas
Total Primary Coal Production
Total Coal Consumption
Coal, Net Exports/Imports (-)
Total Recoverable Coal
Total Electricity Net Generation
Total Electricity Net Consumption
Total Electricity Imports
Electricity, Net Exports/Imports (-)
Total Conventional Thermal Electricity Net Generation
Hydroelectricity Net Generation
Total Primary Energy Production
Total Primary Energy Consumption
Total Carbon Dioxide Emissions from the Consumption of Energy
Population