| Business / Energy Data |
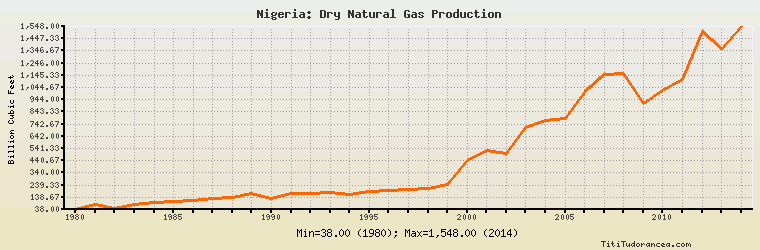
Nigeria: Dry Natural Gas Production
Billion Cubic Feet
| Year | Nigeria | Change, percent | Nigeria, percent of Africa | Nigeria, percent of World |
| 1980 | 38.000 | N/A | 5.534% | 0.071% |
| 1981 | 76.000 | 100.000% | 7.331% | 0.139% |
| 1982 | 50.000 | -34.211% | 4.034% | 0.092% |
| 1983 | 81.000 | 62.000% | 4.807% | 0.147% |
| 1984 | 97.000 | 19.753% | 5.383% | 0.162% |
| 1985 | 108.000 | 11.340% | 5.816% | 0.173% |
| 1986 | 116.000 | 7.407% | 6.179% | 0.182% |
| 1987 | 131.000 | 12.931% | 6.226% | 0.197% |
| 1988 | 133.000 | 1.527% | 5.933% | 0.190% |
| 1989 | 166.000 | 24.812% | 6.936% | 0.230% |
| 1990 | 131.000 | -21.084% | 5.327% | 0.178% |
| 1991 | 168.000 | 28.244% | 6.255% | 0.224% |
| 1992 | 173.000 | 2.976% | 6.242% | 0.230% |
| 1993 | 178.000 | 2.890% | 6.343% | 0.233% |
| 1994 | 161.000 | -9.551% | 5.915% | 0.209% |
| 1995 | 183.000 | 13.665% | 6.087% | 0.234% |
| 1996 | 193.000 | 5.464% | 5.984% | 0.240% |
| 1997 | 207.000 | 7.254% | 5.885% | 0.257% |
| 1998 | 208.000 | 0.483% | 5.625% | 0.254% |
| 1999 | 245.000 | 17.788% | 6.101% | 0.292% |
| 2000 | 440.000 | 79.592% | 9.911% | 0.505% |
| 2001 | 526.000 | 19.545% | 11.367% | 0.592% |
| 2002 | 501.000 | -4.753% | 10.701% | 0.553% |
| 2003 | 717.000 | 43.114% | 14.041% | 0.768% |
| 2004 | 770.000 | 7.392% | 14.444% | 0.805% |
| 2005 | 791.000 | 2.727% | 12.701% | 0.805% |
| 2006 | 1,006.000 | 27.181% | 15.297% | 0.990% |
| 2007 | 1,148.000 | 14.115% | 17.008% | 1.102% |
| 2008 | 1,159.000 | 0.958% | 15.502% | 1.075% |
| 2009 | 912.000 | -21.311% | 12.824% | 0.865% |
| 2010 | 1,024.000 | 12.281% | 13.879% | 0.912% |
| 2011 | 1,107.000 | 8.105% | 15.541% | 0.950% |
| 2012 | 1,503.000 | 35.772% | 19.239% | 1.259% |
| 2013 | 1,356.000 | -9.780% | 18.420% | 1.121% |
| 2014 | 1,548.000 | 14.159% | 21.036% | 1.265% |
Historical Energy Data about Nigeria
Total Oil Supply
Total Consumption of Petroleum Products
Oil and Petroleum Products, Net Exports/Imports (-)
Production of Crude Oil including Lease Condensate
Crude Oil Proved Reserves
Dry Natural Gas Production
Dry Natural Gas Consumption
Dry Natural Gas, Net Exports/Imports (-)
Proved Reserves of Natural Gas
Total Primary Coal Production
Total Coal Consumption
Coal, Net Exports/Imports (-)
Total Recoverable Coal
Total Electricity Net Generation
Total Electricity Net Consumption
Total Electricity Exports
Electricity, Net Exports/Imports (-)
Total Conventional Thermal Electricity Net Generation
Hydroelectricity Net Generation
Total Biofuels Consumption
Total Primary Energy Production
Total Primary Energy Consumption
Total Carbon Dioxide Emissions from the Consumption of Energy
Population