| Business / Energy Data |
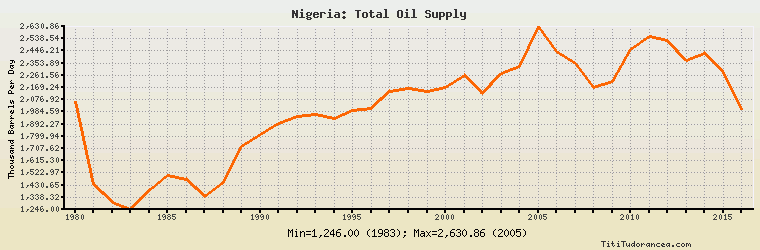
Nigeria: Total Oil Supply
Thousand Barrels Per Day
| Year | Nigeria | Change, percent | Nigeria, percent of Africa | Nigeria, percent of World |
| 1980 | 2,060.000 | N/A | 33.071% | 3.219% |
| 1981 | 1,438.000 | -30.194% | 29.419% | 2.373% |
| 1982 | 1,300.000 | -9.597% | 26.628% | 2.238% |
| 1983 | 1,246.000 | -4.154% | 25.320% | 2.151% |
| 1984 | 1,393.000 | 11.798% | 26.042% | 2.339% |
| 1985 | 1,500.000 | 7.681% | 26.790% | 2.536% |
| 1986 | 1,470.000 | -2.000% | 26.594% | 2.389% |
| 1987 | 1,344.000 | -8.571% | 24.425% | 2.164% |
| 1988 | 1,454.000 | 8.185% | 24.887% | 2.258% |
| 1989 | 1,722.000 | 18.432% | 27.532% | 2.628% |
| 1990 | 1,817.000 | 5.517% | 27.045% | 2.735% |
| 1991 | 1,898.000 | 4.458% | 27.286% | 2.861% |
| 1992 | 1,951.000 | 2.792% | 27.592% | 2.932% |
| 1993 | 1,967.000 | 0.820% | 27.948% | 2.931% |
| 1994 | 1,936.000 | -1.576% | 27.509% | 2.821% |
| 1995 | 1,998.000 | 3.202% | 27.306% | 2.842% |
| 1996 | 2,007.000 | 0.450% | 26.682% | 2.788% |
| 1997 | 2,140.000 | 6.627% | 27.388% | 2.883% |
| 1998 | 2,160.000 | 0.935% | 27.734% | 2.854% |
| 1999 | 2,136.000 | -1.111% | 27.623% | 2.854% |
| 2000 | 2,169.135 | 1.551% | 27.149% | 2.791% |
| 2001 | 2,261.416 | 4.254% | 28.169% | 2.911% |
| 2002 | 2,123.323 | -6.106% | 26.099% | 2.754% |
| 2003 | 2,278.592 | 7.313% | 26.478% | 2.862% |
| 2004 | 2,331.696 | 2.331% | 25.014% | 2.794% |
| 2005 | 2,630.860 | 12.830% | 26.078% | 3.091% |
| 2006 | 2,442.250 | -7.169% | 23.956% | 2.867% |
| 2007 | 2,352.756 | -3.664% | 22.439% | 2.760% |
| 2008 | 2,168.865 | -7.816% | 20.502% | 2.503% |
| 2009 | 2,212.180 | 1.997% | 21.201% | 2.577% |
| 2010 | 2,459.453 | 11.178% | 23.031% | 2.787% |
| 2011 | 2,554.664 | 3.871% | 27.546% | 2.877% |
| 2012 | 2,524.542 | -1.179% | 25.461% | 2.781% |
| 2013 | 2,371.912 | -6.046% | 25.611% | 2.598% |
| 2014 | 2,427.747 | 2.354% | 27.769% | 2.588% |
| 2015 | 2,284.353 | -5.906% | 26.427% | 2.360% |
| 2016 | 2,004.427 | -12.254% | 24.446% | 2.063% |
Historical Energy Data about Nigeria
Total Oil Supply
Total Consumption of Petroleum Products
Oil and Petroleum Products, Net Exports/Imports (-)
Production of Crude Oil including Lease Condensate
Crude Oil Proved Reserves
Dry Natural Gas Production
Dry Natural Gas Consumption
Dry Natural Gas, Net Exports/Imports (-)
Proved Reserves of Natural Gas
Total Primary Coal Production
Total Coal Consumption
Coal, Net Exports/Imports (-)
Total Recoverable Coal
Total Electricity Net Generation
Total Electricity Net Consumption
Total Electricity Exports
Electricity, Net Exports/Imports (-)
Total Conventional Thermal Electricity Net Generation
Hydroelectricity Net Generation
Total Biofuels Consumption
Total Primary Energy Production
Total Primary Energy Consumption
Total Carbon Dioxide Emissions from the Consumption of Energy
Population