| Business / Energy Data |
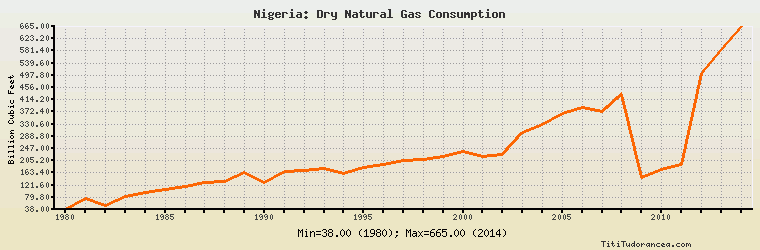
Nigeria: Dry Natural Gas Consumption
Billion Cubic Feet
| Year | Nigeria | Change, percent | Nigeria, percent of Africa | Nigeria, percent of World |
| 1980 | 38.000 | N/A | 5.166% | 0.072% |
| 1981 | 76.000 | 100.000% | 12.445% | 0.142% |
| 1982 | 50.000 | -34.211% | 6.108% | 0.093% |
| 1983 | 81.000 | 62.000% | 8.074% | 0.148% |
| 1984 | 97.000 | 19.753% | 8.842% | 0.162% |
| 1985 | 108.000 | 11.340% | 10.075% | 0.174% |
| 1986 | 116.000 | 7.407% | 10.145% | 0.184% |
| 1987 | 131.000 | 12.931% | 10.571% | 0.198% |
| 1988 | 133.000 | 1.527% | 10.164% | 0.191% |
| 1989 | 166.000 | 24.812% | 12.395% | 0.228% |
| 1990 | 131.000 | -21.084% | 9.541% | 0.178% |
| 1991 | 168.000 | 28.244% | 11.164% | 0.223% |
| 1992 | 173.000 | 2.976% | 11.668% | 0.230% |
| 1993 | 178.000 | 2.890% | 11.541% | 0.231% |
| 1994 | 161.000 | -9.551% | 10.006% | 0.209% |
| 1995 | 183.000 | 13.665% | 10.832% | 0.232% |
| 1996 | 193.000 | 5.464% | 10.786% | 0.238% |
| 1997 | 207.000 | 7.254% | 11.573% | 0.255% |
| 1998 | 208.000 | 0.483% | 11.344% | 0.255% |
| 1999 | 219.000 | 5.288% | 11.702% | 0.261% |
| 2000 | 238.000 | 8.676% | 11.675% | 0.273% |
| 2001 | 219.000 | -7.983% | 9.590% | 0.250% |
| 2002 | 225.000 | 2.740% | 9.510% | 0.246% |
| 2003 | 301.000 | 33.778% | 11.682% | 0.321% |
| 2004 | 329.000 | 9.302% | 12.495% | 0.340% |
| 2005 | 366.000 | 11.246% | 12.130% | 0.368% |
| 2006 | 386.000 | 5.464% | 13.258% | 0.378% |
| 2007 | 374.000 | -3.109% | 12.485% | 0.354% |
| 2008 | 433.000 | 15.775% | 11.975% | 0.397% |
| 2009 | 147.000 | -66.051% | 4.342% | 0.139% |
| 2010 | 176.000 | 19.728% | 4.949% | 0.154% |
| 2011 | 191.000 | 8.523% | 4.886% | 0.163% |
| 2012 | 505.000 | 164.398% | 11.271% | 0.418% |
| 2013 | 585.000 | 15.842% | 13.033% | 0.477% |
| 2014 | 665.000 | 13.675% | 14.183% | 0.542% |
Historical Energy Data about Nigeria
Total Oil Supply
Total Consumption of Petroleum Products
Oil and Petroleum Products, Net Exports/Imports (-)
Production of Crude Oil including Lease Condensate
Crude Oil Proved Reserves
Dry Natural Gas Production
Dry Natural Gas Consumption
Dry Natural Gas, Net Exports/Imports (-)
Proved Reserves of Natural Gas
Total Primary Coal Production
Total Coal Consumption
Coal, Net Exports/Imports (-)
Total Recoverable Coal
Total Electricity Net Generation
Total Electricity Net Consumption
Total Electricity Exports
Electricity, Net Exports/Imports (-)
Total Conventional Thermal Electricity Net Generation
Hydroelectricity Net Generation
Total Biofuels Consumption
Total Primary Energy Production
Total Primary Energy Consumption
Total Carbon Dioxide Emissions from the Consumption of Energy
Population