| Business / Energy Data |
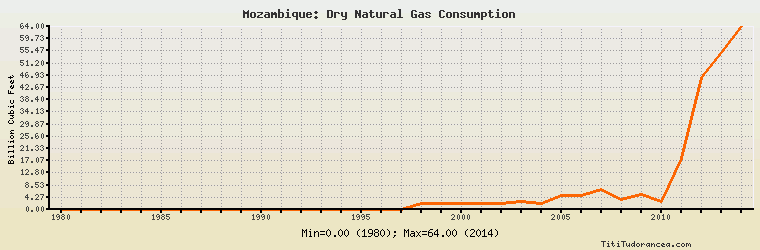
Mozambique: Dry Natural Gas Consumption
Billion Cubic Feet
| Year | Mozambique | Change, percent | Mozambique, percent of Africa | Mozambique, percent of World |
| 1980 | 0.000 | N/A | 0.00% | 0.00% |
| 1981 | 0.000 | 0.000% | 0.00% | 0.00% |
| 1982 | 0.000 | 0.000% | 0.00% | 0.00% |
| 1983 | 0.000 | 0.000% | 0.00% | 0.00% |
| 1984 | 0.000 | 0.000% | 0.00% | 0.00% |
| 1985 | 0.000 | 0.000% | 0.00% | 0.00% |
| 1986 | 0.000 | 0.000% | 0.00% | 0.00% |
| 1987 | 0.000 | 0.000% | 0.00% | 0.00% |
| 1988 | 0.000 | 0.000% | 0.00% | 0.00% |
| 1989 | 0.000 | 0.000% | 0.00% | 0.00% |
| 1990 | 0.000 | 0.000% | 0.00% | 0.00% |
| 1991 | 0.000 | 0.000% | 0.00% | 0.00% |
| 1992 | 0.000 | 0.000% | 0.00% | 0.00% |
| 1993 | 0.000 | 0.000% | 0.00% | 0.00% |
| 1994 | 0.000 | 0.000% | 0.00% | 0.00% |
| 1995 | 0.000 | 0.000% | 0.00% | 0.00% |
| 1996 | 0.000 | 0.000% | 0.00% | 0.00% |
| 1997 | 0.000 | 0.000% | 0.00% | 0.00% |
| 1998 | 2.100 | 0.000% | 0.115% | 0.003% |
| 1999 | 2.100 | 0.000% | 0.112% | 0.003% |
| 2000 | 2.100 | 0.000% | 0.103% | 0.002% |
| 2001 | 2.100 | 0.000% | 0.092% | 0.002% |
| 2002 | 2.100 | 0.000% | 0.089% | 0.002% |
| 2003 | 2.800 | 33.333% | 0.109% | 0.003% |
| 2004 | 2.000 | -28.571% | 0.076% | 0.002% |
| 2005 | 5.000 | 150.000% | 0.166% | 0.005% |
| 2006 | 5.000 | 0.000% | 0.172% | 0.005% |
| 2007 | 7.100 | 42.000% | 0.237% | 0.007% |
| 2008 | 3.500 | -50.704% | 0.097% | 0.003% |
| 2009 | 5.300 | 51.429% | 0.157% | 0.005% |
| 2010 | 2.800 | -47.170% | 0.079% | 0.002% |
| 2011 | 18.000 | 542.857% | 0.460% | 0.015% |
| 2012 | 46.000 | 155.556% | 1.027% | 0.038% |
| 2013 | 55.000 | 19.565% | 1.225% | 0.045% |
| 2014 | 64.000 | 16.364% | 1.365% | 0.052% |
Historical Energy Data about Mozambique
Total Consumption of Petroleum Products
Oil and Petroleum Products, Net Exports/Imports (-)
Dry Natural Gas Production
Dry Natural Gas Consumption
Dry Natural Gas, Net Exports/Imports (-)
Proved Reserves of Natural Gas
Total Primary Coal Production
Total Coal Consumption
Coal, Net Exports/Imports (-)
Total Recoverable Coal
Total Electricity Net Generation
Total Electricity Net Consumption
Total Electricity Exports
Total Electricity Imports
Electricity, Net Exports/Imports (-)
Total Conventional Thermal Electricity Net Generation
Hydroelectricity Net Generation
Total Primary Energy Production
Total Primary Energy Consumption
Total Carbon Dioxide Emissions from the Consumption of Energy
Population