| Business / Energy Data |
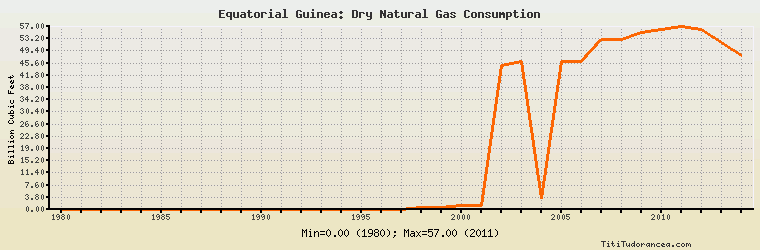
Equatorial Guinea: Dry Natural Gas Consumption
Billion Cubic Feet
| Year | Equatorial Guinea | Change, percent | Equatorial Guinea, percent of Africa | Equatorial Guinea, percent of World |
| 1980 | 0.000 | N/A | 0.00% | 0.00% |
| 1981 | 0.000 | 0.000% | 0.00% | 0.00% |
| 1982 | 0.000 | 0.000% | 0.00% | 0.00% |
| 1983 | 0.000 | 0.000% | 0.00% | 0.00% |
| 1984 | 0.000 | 0.000% | 0.00% | 0.00% |
| 1985 | 0.000 | 0.000% | 0.00% | 0.00% |
| 1986 | 0.000 | 0.000% | 0.00% | 0.00% |
| 1987 | 0.000 | 0.000% | 0.00% | 0.00% |
| 1988 | 0.000 | 0.000% | 0.00% | 0.00% |
| 1989 | 0.000 | 0.000% | 0.00% | 0.00% |
| 1990 | 0.000 | 0.000% | 0.00% | 0.00% |
| 1991 | 0.000 | 0.000% | 0.00% | 0.00% |
| 1992 | 0.000 | 0.000% | 0.00% | 0.00% |
| 1993 | 0.000 | 0.000% | 0.00% | 0.00% |
| 1994 | 0.000 | 0.000% | 0.00% | 0.00% |
| 1995 | 0.000 | 0.000% | 0.00% | 0.00% |
| 1996 | 0.000 | 0.000% | 0.00% | 0.00% |
| 1997 | 0.000 | 0.000% | 0.00% | 0.00% |
| 1998 | 0.700 | 0.000% | 0.038% | 0.001% |
| 1999 | 0.700 | 0.000% | 0.037% | 0.001% |
| 2000 | 1.100 | 57.143% | 0.054% | 0.001% |
| 2001 | 1.100 | 0.000% | 0.048% | 0.001% |
| 2002 | 45.000 | 3,990.909% | 1.902% | 0.049% |
| 2003 | 46.000 | 2.222% | 1.785% | 0.049% |
| 2004 | 3.500 | -92.391% | 0.133% | 0.004% |
| 2005 | 46.000 | 1,214.286% | 1.525% | 0.046% |
| 2006 | 46.000 | 0.000% | 1.580% | 0.045% |
| 2007 | 53.000 | 15.217% | 1.769% | 0.050% |
| 2008 | 53.000 | 0.000% | 1.466% | 0.049% |
| 2009 | 55.000 | 3.774% | 1.625% | 0.052% |
| 2010 | 56.000 | 1.818% | 1.575% | 0.049% |
| 2011 | 57.000 | 1.786% | 1.458% | 0.049% |
| 2012 | 56.000 | -1.754% | 1.250% | 0.046% |
| 2013 | 52.000 | -7.143% | 1.158% | 0.042% |
| 2014 | 48.000 | -7.692% | 1.024% | 0.039% |
Historical Energy Data about Equatorial Guinea
Total Oil Supply
Total Consumption of Petroleum Products
Oil and Petroleum Products, Net Exports/Imports (-)
Production of Crude Oil including Lease Condensate
Crude Oil Proved Reserves
Dry Natural Gas Production
Dry Natural Gas Consumption
Dry Natural Gas, Net Exports/Imports (-)
Proved Reserves of Natural Gas
Coal, Net Exports/Imports (-)
Total Electricity Net Generation
Total Electricity Net Consumption
Electricity, Net Exports/Imports (-)
Total Conventional Thermal Electricity Net Generation
Hydroelectricity Net Generation
Total Primary Energy Production
Total Primary Energy Consumption
Total Carbon Dioxide Emissions from the Consumption of Energy
Population