| Business / Energy Data |
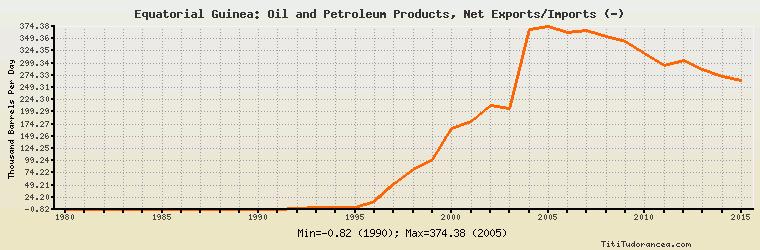
Equatorial Guinea: Oil and Petroleum Products, Net Exports/Imports (-)
Thousand Barrels Per Day
| Year | Equatorial Guinea | Change, percent | Equatorial Guinea, percent of Africa | Equatorial Guinea, percent of World |
| 1980 | -0.400 | N/A | -0.008% | N/A |
| 1981 | -0.400 | 0.000% | -0.012% | N/A |
| 1982 | -0.500 | 25.000% | -0.016% | N/A |
| 1983 | -0.500 | 0.000% | -0.016% | N/A |
| 1984 | -0.500 | 0.000% | -0.014% | N/A |
| 1985 | -0.575 | 15.000% | -0.015% | N/A |
| 1986 | -0.575 | 0.000% | -0.016% | N/A |
| 1987 | -0.552 | -4.000% | -0.015% | N/A |
| 1988 | -0.551 | -0.181% | -0.014% | N/A |
| 1989 | -0.794 | 44.102% | -0.019% | N/A |
| 1990 | -0.815 | 2.645% | -0.018% | N/A |
| 1991 | -0.800 | -1.840% | -0.017% | N/A |
| 1992 | 0.800 | -200.000% | 0.016% | N/A |
| 1993 | 3.600 | 350.000% | 0.074% | N/A |
| 1994 | 4.100 | 13.889% | 0.084% | N/A |
| 1995 | 4.100 | 0.000% | 0.081% | N/A |
| 1996 | 16.100 | 292.683% | 0.309% | N/A |
| 1997 | 51.000 | 216.770% | 0.937% | N/A |
| 1998 | 82.000 | 60.784% | 1.523% | N/A |
| 1999 | 101.000 | 23.171% | 1.912% | N/A |
| 2000 | 166.000 | 64.356% | 3.057% | N/A |
| 2001 | 180.338 | 8.637% | 3.335% | N/A |
| 2002 | 211.462 | 17.259% | 3.896% | N/A |
| 2003 | 205.266 | -2.930% | 3.509% | N/A |
| 2004 | 367.208 | 78.894% | 5.675% | N/A |
| 2005 | 374.377 | 1.952% | 5.259% | N/A |
| 2006 | 361.766 | -3.369% | 5.034% | N/A |
| 2007 | 366.829 | 1.400% | 4.935% | N/A |
| 2008 | 354.003 | -3.496% | 4.788% | N/A |
| 2009 | 342.916 | -3.132% | 4.834% | N/A |
| 2010 | 318.110 | -7.234% | 4.445% | N/A |
| 2011 | 293.988 | -7.583% | 5.043% | N/A |
| 2012 | 305.500 | 3.916% | 4.872% | N/A |
| 2013 | 285.597 | -6.515% | 5.238% | N/A |
| 2014 | 272.800 | -4.481% | 5.739% | N/A |
| 2015 | 262.800 | -3.666% | 5.659% | N/A |
Historical Energy Data about Equatorial Guinea
Total Oil Supply
Total Consumption of Petroleum Products
Oil and Petroleum Products, Net Exports/Imports (-)
Production of Crude Oil including Lease Condensate
Crude Oil Proved Reserves
Dry Natural Gas Production
Dry Natural Gas Consumption
Dry Natural Gas, Net Exports/Imports (-)
Proved Reserves of Natural Gas
Coal, Net Exports/Imports (-)
Total Electricity Net Generation
Total Electricity Net Consumption
Electricity, Net Exports/Imports (-)
Total Conventional Thermal Electricity Net Generation
Hydroelectricity Net Generation
Total Primary Energy Production
Total Primary Energy Consumption
Total Carbon Dioxide Emissions from the Consumption of Energy
Population