| Business / Energy Data |
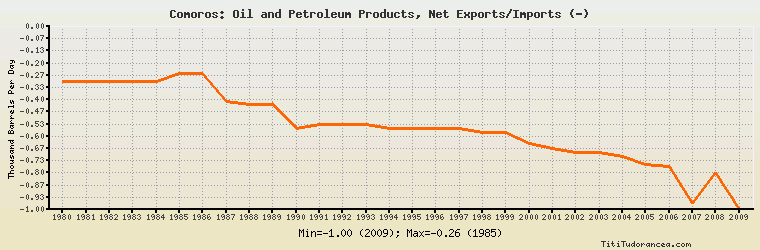
Comoros: Oil and Petroleum Products, Net Exports/Imports (-)
Thousand Barrels Per Day
| Year | Comoros | Change, percent | Comoros, percent of Africa | Comoros, percent of World |
| 1980 | -0.300 | N/A | -0.006% | N/A |
| 1981 | -0.300 | 0.000% | -0.009% | N/A |
| 1982 | -0.300 | 0.000% | -0.009% | N/A |
| 1983 | -0.300 | 0.000% | -0.009% | N/A |
| 1984 | -0.300 | 0.000% | -0.008% | N/A |
| 1985 | -0.256 | -14.667% | -0.007% | N/A |
| 1986 | -0.256 | 0.000% | -0.007% | N/A |
| 1987 | -0.408 | 59.375% | -0.011% | N/A |
| 1988 | -0.427 | 4.657% | -0.011% | N/A |
| 1989 | -0.428 | 0.234% | -0.010% | N/A |
| 1990 | -0.558 | 30.374% | -0.012% | N/A |
| 1991 | -0.537 | -3.763% | -0.011% | N/A |
| 1992 | -0.536 | -0.186% | -0.011% | N/A |
| 1993 | -0.537 | 0.187% | -0.011% | N/A |
| 1994 | -0.558 | 3.911% | -0.011% | N/A |
| 1995 | -0.556 | -0.358% | -0.011% | N/A |
| 1996 | -0.556 | 0.000% | -0.011% | N/A |
| 1997 | -0.558 | 0.360% | -0.010% | N/A |
| 1998 | -0.581 | 4.122% | -0.011% | N/A |
| 1999 | -0.581 | 0.000% | -0.011% | N/A |
| 2000 | -0.642 | 10.499% | -0.012% | N/A |
| 2001 | -0.667 | 3.894% | -0.012% | N/A |
| 2002 | -0.688 | 3.148% | -0.013% | N/A |
| 2003 | -0.688 | 0.000% | -0.012% | N/A |
| 2004 | -0.709 | 3.052% | -0.011% | N/A |
| 2005 | -0.755 | 6.488% | -0.011% | N/A |
| 2006 | -0.766 | 1.457% | -0.011% | N/A |
| 2007 | -0.967 | 26.240% | -0.013% | N/A |
| 2008 | -0.800 | -17.270% | -0.011% | N/A |
| 2009 | -1.000 | 25.000% | -0.014% | N/A |
Historical Energy Data about Comoros
Total Consumption of Petroleum Products
Oil and Petroleum Products, Net Exports/Imports (-)
Dry Natural Gas, Net Exports/Imports (-)
Coal, Net Exports/Imports (-)
Total Electricity Net Generation
Total Electricity Net Consumption
Electricity, Net Exports/Imports (-)
Total Conventional Thermal Electricity Net Generation
Hydroelectricity Net Generation
Total Primary Energy Consumption
Total Carbon Dioxide Emissions from the Consumption of Energy
Population