| Business / Energy Data |
Burundi: Oil and Petroleum Products, Net Exports/Imports (-)
Thousand Barrels Per Day
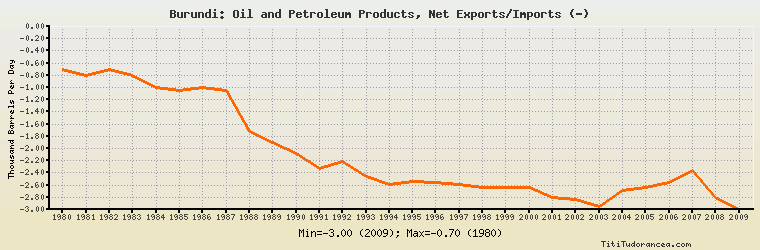
| Year | Burundi | Change, percent | Burundi, percent of Africa | Burundi, percent of World |
| 1980 | -0.700 | N/A | -0.015% | N/A |
| 1981 | -0.800 | 14.286% | -0.024% | N/A |
| 1982 | -0.700 | -12.500% | -0.022% | N/A |
| 1983 | -0.800 | 14.286% | -0.025% | N/A |
| 1984 | -1.000 | 25.000% | -0.028% | N/A |
| 1985 | -1.044 | 4.400% | -0.028% | N/A |
| 1986 | -1.007 | -3.544% | -0.027% | N/A |
| 1987 | -1.048 | 4.071% | -0.029% | N/A |
| 1988 | -1.726 | 64.695% | -0.044% | N/A |
| 1989 | -1.907 | 10.487% | -0.045% | N/A |
| 1990 | -2.085 | 9.334% | -0.045% | N/A |
| 1991 | -2.325 | 11.511% | -0.048% | N/A |
| 1992 | -2.214 | -4.774% | -0.045% | N/A |
| 1993 | -2.464 | 11.292% | -0.051% | N/A |
| 1994 | -2.596 | 5.357% | -0.053% | N/A |
| 1995 | -2.533 | -2.427% | -0.050% | N/A |
| 1996 | -2.564 | 1.224% | -0.049% | N/A |
| 1997 | -2.595 | 1.209% | -0.048% | N/A |
| 1998 | -2.637 | 1.618% | -0.049% | N/A |
| 1999 | -2.637 | 0.000% | -0.050% | N/A |
| 2000 | -2.637 | 0.000% | -0.049% | N/A |
| 2001 | -2.798 | 6.105% | -0.052% | N/A |
| 2002 | -2.830 | 1.144% | -0.052% | N/A |
| 2003 | -2.944 | 4.028% | -0.050% | N/A |
| 2004 | -2.687 | -8.730% | -0.042% | N/A |
| 2005 | -2.635 | -1.935% | -0.037% | N/A |
| 2006 | -2.557 | -2.960% | -0.036% | N/A |
| 2007 | -2.355 | -7.900% | -0.032% | N/A |
| 2008 | -2.800 | 18.896% | -0.038% | N/A |
| 2009 | -3.000 | 7.143% | -0.042% | N/A |
Historical Energy Data about Burundi
Total Consumption of Petroleum Products
Oil and Petroleum Products, Net Exports/Imports (-)
Dry Natural Gas, Net Exports/Imports (-)
Coal, Net Exports/Imports (-)
Total Electricity Net Generation
Total Electricity Net Consumption
Total Electricity Imports
Electricity, Net Exports/Imports (-)
Total Conventional Thermal Electricity Net Generation
Hydroelectricity Net Generation
Total Primary Energy Production
Total Primary Energy Consumption
Total Carbon Dioxide Emissions from the Consumption of Energy
Population