| Business / Demographics |
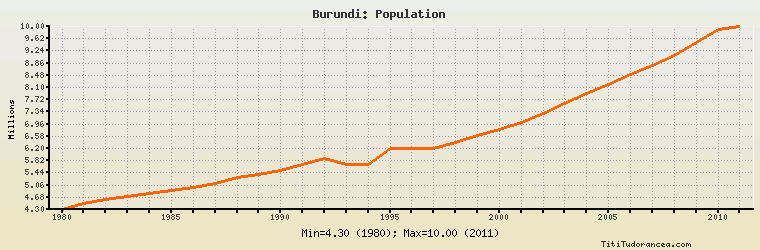
Burundi: Population
Millions
| Year | Burundi | Change, percent | Burundi, percent of Africa | Burundi, percent of World |
| 1980 | 4.300 | N/A | 0.906% | 0.097% |
| 1981 | 4.500 | 4.651% | 0.922% | 0.099% |
| 1982 | 4.600 | 2.222% | 0.907% | 0.100% |
| 1983 | 4.700 | 2.174% | 0.905% | 0.100% |
| 1984 | 4.800 | 2.128% | 0.902% | 0.101% |
| 1985 | 4.900 | 2.083% | 0.894% | 0.101% |
| 1986 | 5.000 | 2.041% | 0.889% | 0.101% |
| 1987 | 5.100 | 2.000% | 0.882% | 0.102% |
| 1988 | 5.300 | 3.922% | 0.890% | 0.104% |
| 1989 | 5.400 | 1.887% | 0.883% | 0.104% |
| 1990 | 5.500 | 1.852% | 0.876% | 0.104% |
| 1991 | 5.700 | 3.636% | 0.886% | 0.106% |
| 1992 | 5.900 | 3.509% | 0.893% | 0.108% |
| 1993 | 5.700 | -3.390% | 0.843% | 0.103% |
| 1994 | 5.700 | 0.000% | 0.819% | 0.101% |
| 1995 | 6.200 | 8.772% | 0.868% | 0.109% |
| 1996 | 6.200 | 0.000% | 0.848% | 0.107% |
| 1997 | 6.200 | 0.000% | 0.830% | 0.106% |
| 1998 | 6.400 | 3.226% | 0.837% | 0.108% |
| 1999 | 6.600 | 3.125% | 0.841% | 0.110% |
| 2000 | 6.800 | 3.030% | 0.845% | 0.112% |
| 2001 | 7.000 | 2.941% | 0.852% | 0.114% |
| 2002 | 7.300 | 4.286% | 0.865% | 0.117% |
| 2003 | 7.600 | 4.110% | 0.879% | 0.120% |
| 2004 | 7.900 | 3.947% | 0.890% | 0.124% |
| 2005 | 8.200 | 3.797% | 0.902% | 0.127% |
| 2006 | 8.500 | 3.659% | 0.911% | 0.130% |
| 2007 | 8.800 | 3.529% | 0.924% | 0.133% |
| 2008 | 9.100 | 3.409% | 0.933% | 0.136% |
| 2009 | 9.500 | 4.396% | 0.949% | 0.140% |
| 2010 | 9.900 | 4.211% | 0.965% | 0.144% |
| 2011 | 10.000 | 1.010% | 0.949% | 0.144% |
Historical Energy Data about Burundi
Total Consumption of Petroleum Products
Oil and Petroleum Products, Net Exports/Imports (-)
Dry Natural Gas, Net Exports/Imports (-)
Coal, Net Exports/Imports (-)
Total Electricity Net Generation
Total Electricity Net Consumption
Total Electricity Imports
Electricity, Net Exports/Imports (-)
Total Conventional Thermal Electricity Net Generation
Hydroelectricity Net Generation
Total Primary Energy Production
Total Primary Energy Consumption
Total Carbon Dioxide Emissions from the Consumption of Energy
Population