| Business / Energy Data |
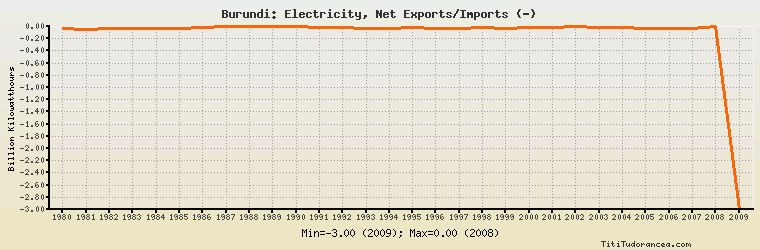
Burundi: Electricity, Net Exports/Imports (-)
Billion Kilowatthours
| Year | Burundi | Change, percent | Burundi, percent of Africa | Burundi, percent of World |
| 1980 | -0.039 | N/A | - | N/A |
| 1981 | -0.041 | 5.128% | - | N/A |
| 1982 | -0.037 | -9.756% | 411.111% | N/A |
| 1983 | -0.034 | -8.108% | 12.230% | N/A |
| 1984 | -0.032 | -5.882% | 62.745% | N/A |
| 1985 | -0.039 | 21.875% | - | N/A |
| 1986 | -0.022 | -43.590% | 19.130% | N/A |
| 1987 | -0.005 | -77.273% | 2.500% | N/A |
| 1988 | -0.005 | 0.000% | 1.866% | N/A |
| 1989 | -0.006 | 20.000% | 6.122% | N/A |
| 1990 | -0.008 | 33.333% | 1.639% | N/A |
| 1991 | -0.015 | 87.500% | 6.410% | N/A |
| 1992 | -0.016 | 6.667% | -10.811% | N/A |
| 1993 | -0.027 | 68.750% | 52.941% | N/A |
| 1994 | -0.035 | 29.630% | 27.778% | N/A |
| 1995 | -0.021 | -40.000% | -4.615% | N/A |
| 1996 | -0.027 | 28.571% | -1.523% | N/A |
| 1997 | -0.027 | 0.000% | -1.712% | N/A |
| 1998 | -0.021 | -22.222% | 0.596% | N/A |
| 1999 | -0.028 | 33.333% | 1.136% | N/A |
| 2000 | -0.023 | -17.857% | 0.612% | N/A |
| 2001 | -0.012 | -47.826% | 0.436% | N/A |
| 2002 | -0.006 | -50.000% | 0.330% | N/A |
| 2003 | -0.018 | 200.000% | 0.574% | N/A |
| 2004 | -0.014 | -22.222% | 0.853% | N/A |
| 2005 | -0.033 | 135.714% | 1.492% | N/A |
| 2006 | -0.033 | 0.000% | 0.812% | N/A |
| 2007 | -0.034 | 3.030% | 0.742% | N/A |
| 2008 | 0.000 | -100.000% | 0.00% | N/A |
| 2009 | -3.000 | 0.000% | 69.606% | N/A |
Historical Energy Data about Burundi
Total Consumption of Petroleum Products
Oil and Petroleum Products, Net Exports/Imports (-)
Dry Natural Gas, Net Exports/Imports (-)
Coal, Net Exports/Imports (-)
Total Electricity Net Generation
Total Electricity Net Consumption
Total Electricity Imports
Electricity, Net Exports/Imports (-)
Total Conventional Thermal Electricity Net Generation
Hydroelectricity Net Generation
Total Primary Energy Production
Total Primary Energy Consumption
Total Carbon Dioxide Emissions from the Consumption of Energy
Population