| Business / Energy Data |
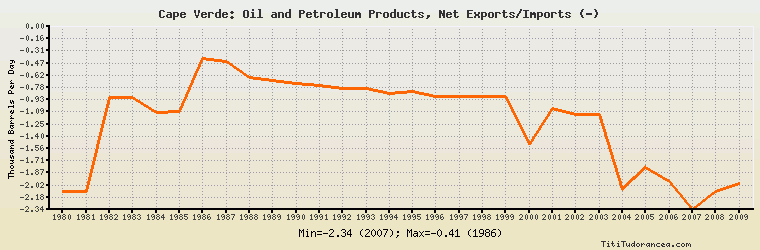
Cape Verde: Oil and Petroleum Products, Net Exports/Imports (-)
Thousand Barrels Per Day
| Year | Cape Verde | Change, percent | Cape Verde, percent of Africa | Cape Verde, percent of World |
| 1980 | -2.100 | N/A | -0.044% | N/A |
| 1981 | -2.100 | 0.000% | -0.063% | N/A |
| 1982 | -0.900 | -57.143% | -0.028% | N/A |
| 1983 | -0.900 | 0.000% | -0.028% | N/A |
| 1984 | -1.100 | 22.222% | -0.031% | N/A |
| 1985 | -1.089 | -1.000% | -0.029% | N/A |
| 1986 | -0.409 | -62.443% | -0.011% | N/A |
| 1987 | -0.449 | 9.780% | -0.012% | N/A |
| 1988 | -0.649 | 44.543% | -0.016% | N/A |
| 1989 | -0.692 | 6.626% | -0.016% | N/A |
| 1990 | -0.733 | 5.925% | -0.016% | N/A |
| 1991 | -0.753 | 2.729% | -0.016% | N/A |
| 1992 | -0.792 | 5.179% | -0.016% | N/A |
| 1993 | -0.794 | 0.253% | -0.016% | N/A |
| 1994 | -0.859 | 8.186% | -0.018% | N/A |
| 1995 | -0.835 | -2.794% | -0.016% | N/A |
| 1996 | -0.888 | 6.347% | -0.017% | N/A |
| 1997 | -0.891 | 0.338% | -0.016% | N/A |
| 1998 | -0.891 | 0.000% | -0.017% | N/A |
| 1999 | -0.891 | 0.000% | -0.017% | N/A |
| 2000 | -1.504 | 68.799% | -0.028% | N/A |
| 2001 | -1.048 | -30.319% | -0.019% | N/A |
| 2002 | -1.124 | 7.252% | -0.021% | N/A |
| 2003 | -1.124 | 0.000% | -0.019% | N/A |
| 2004 | -2.080 | 85.053% | -0.032% | N/A |
| 2005 | -1.802 | -13.365% | -0.025% | N/A |
| 2006 | -1.984 | 10.100% | -0.028% | N/A |
| 2007 | -2.336 | 17.742% | -0.031% | N/A |
| 2008 | -2.100 | -10.103% | -0.028% | N/A |
| 2009 | -2.000 | -4.762% | -0.028% | N/A |
Historical Energy Data about Cape Verde
Total Consumption of Petroleum Products
Oil and Petroleum Products, Net Exports/Imports (-)
Dry Natural Gas, Net Exports/Imports (-)
Coal, Net Exports/Imports (-)
Total Electricity Net Generation
Total Electricity Net Consumption
Electricity, Net Exports/Imports (-)
Total Conventional Thermal Electricity Net Generation
Total Primary Energy Consumption
Total Carbon Dioxide Emissions from the Consumption of Energy
Population