| Business / Energy Data |
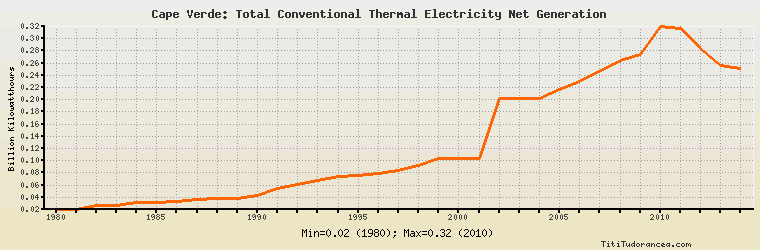
Cape Verde: Total Conventional Thermal Electricity Net Generation
Billion Kilowatthours
| Year | Cape Verde | Change, percent | Cape Verde, percent of Africa | Cape Verde, percent of World |
| 1980 | 0.015 | N/A | 0.012% | 0.000% |
| 1981 | 0.015 | 0.000% | 0.010% | 0.000% |
| 1982 | 0.021 | 40.000% | 0.014% | 0.000% |
| 1983 | 0.022 | 4.762% | 0.013% | 0.000% |
| 1984 | 0.026 | 18.182% | 0.014% | 0.000% |
| 1985 | 0.027 | 3.846% | 0.014% | 0.000% |
| 1986 | 0.028 | 3.704% | 0.014% | 0.000% |
| 1987 | 0.031 | 10.714% | 0.014% | 0.000% |
| 1988 | 0.033 | 6.452% | 0.015% | 0.000% |
| 1989 | 0.033 | 0.000% | 0.014% | 0.000% |
| 1990 | 0.039 | 18.182% | 0.016% | 0.001% |
| 1991 | 0.050 | 28.205% | 0.020% | 0.001% |
| 1992 | 0.057 | 14.000% | 0.023% | 0.001% |
| 1993 | 0.064 | 12.281% | 0.024% | 0.001% |
| 1994 | 0.070 | 9.375% | 0.025% | 0.001% |
| 1995 | 0.072 | 2.857% | 0.025% | 0.001% |
| 1996 | 0.076 | 5.556% | 0.026% | 0.001% |
| 1997 | 0.081 | 6.579% | 0.026% | 0.001% |
| 1998 | 0.088 | 8.642% | 0.029% | 0.001% |
| 1999 | 0.100 | 13.636% | 0.032% | 0.001% |
| 2000 | 0.100 | 0.000% | 0.030% | 0.001% |
| 2001 | 0.100 | 0.000% | 0.029% | 0.001% |
| 2002 | 0.200 | 100.000% | 0.055% | 0.002% |
| 2003 | 0.200 | 0.000% | 0.052% | 0.002% |
| 2004 | 0.200 | 0.000% | 0.049% | 0.002% |
| 2005 | 0.216 | 8.000% | 0.050% | 0.002% |
| 2006 | 0.229 | 6.019% | 0.051% | 0.002% |
| 2007 | 0.246 | 7.424% | 0.052% | 0.002% |
| 2008 | 0.264 | 7.317% | 0.055% | 0.002% |
| 2009 | 0.274 | 3.788% | 0.057% | 0.002% |
| 2010 | 0.321 | 17.153% | 0.063% | 0.002% |
| 2011 | 0.317 | -1.246% | 0.060% | 0.002% |
| 2012 | 0.284 | -10.410% | 0.051% | 0.002% |
| 2013 | 0.256 | -9.859% | 0.045% | 0.002% |
| 2014 | 0.250 | -2.344% | 0.044% | 0.002% |
Historical Energy Data about Cape Verde
Total Consumption of Petroleum Products
Oil and Petroleum Products, Net Exports/Imports (-)
Dry Natural Gas, Net Exports/Imports (-)
Coal, Net Exports/Imports (-)
Total Electricity Net Generation
Total Electricity Net Consumption
Electricity, Net Exports/Imports (-)
Total Conventional Thermal Electricity Net Generation
Total Primary Energy Consumption
Total Carbon Dioxide Emissions from the Consumption of Energy
Population