| Business / Energy Data |
Cape Verde: Total Electricity Net Consumption
Billion Kilowatthours
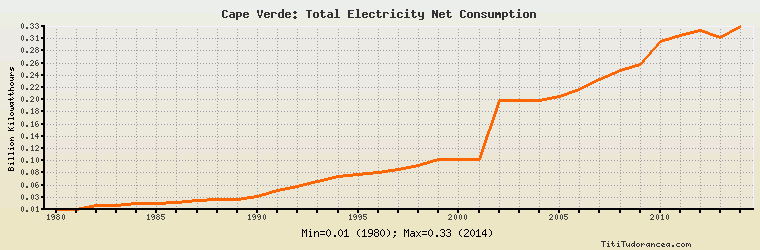
| Year | Cape Verde | Change, percent | Cape Verde, percent of Africa | Cape Verde, percent of World |
| 1980 | 0.014 | N/A | 0.008% | 0.000% |
| 1981 | 0.014 | 0.000% | 0.008% | 0.000% |
| 1982 | 0.020 | 42.857% | 0.011% | 0.000% |
| 1983 | 0.020 | 0.000% | 0.010% | 0.000% |
| 1984 | 0.024 | 20.000% | 0.011% | 0.000% |
| 1985 | 0.025 | 4.167% | 0.011% | 0.000% |
| 1986 | 0.026 | 4.000% | 0.011% | 0.000% |
| 1987 | 0.029 | 11.538% | 0.012% | 0.000% |
| 1988 | 0.031 | 6.897% | 0.012% | 0.000% |
| 1989 | 0.031 | 0.000% | 0.012% | 0.000% |
| 1990 | 0.036 | 16.129% | 0.013% | 0.000% |
| 1991 | 0.047 | 30.556% | 0.017% | 0.000% |
| 1992 | 0.053 | 12.766% | 0.019% | 0.000% |
| 1993 | 0.061 | 15.094% | 0.021% | 0.001% |
| 1994 | 0.070 | 14.754% | 0.023% | 0.001% |
| 1995 | 0.073 | 4.286% | 0.023% | 0.001% |
| 1996 | 0.077 | 5.479% | 0.024% | 0.001% |
| 1997 | 0.082 | 6.494% | 0.024% | 0.001% |
| 1998 | 0.089 | 8.537% | 0.026% | 0.001% |
| 1999 | 0.100 | 12.360% | 0.028% | 0.001% |
| 2000 | 0.100 | 0.000% | 0.027% | 0.001% |
| 2001 | 0.100 | 0.000% | 0.026% | 0.001% |
| 2002 | 0.200 | 100.000% | 0.049% | 0.001% |
| 2003 | 0.200 | 0.000% | 0.047% | 0.001% |
| 2004 | 0.200 | 0.000% | 0.045% | 0.001% |
| 2005 | 0.206 | 3.000% | 0.044% | 0.001% |
| 2006 | 0.219 | 6.311% | 0.045% | 0.001% |
| 2007 | 0.235 | 7.306% | 0.045% | 0.001% |
| 2008 | 0.251 | 6.809% | 0.048% | 0.001% |
| 2009 | 0.261 | 3.984% | 0.050% | 0.002% |
| 2010 | 0.300 | 14.943% | 0.054% | 0.002% |
| 2011 | 0.310 | 3.333% | 0.054% | 0.002% |
| 2012 | 0.320 | 3.226% | 0.054% | 0.002% |
| 2013 | 0.308 | -3.750% | 0.051% | 0.002% |
| 2014 | 0.326 | 5.844% | 0.053% | 0.002% |
Historical Energy Data about Cape Verde
Total Consumption of Petroleum Products
Oil and Petroleum Products, Net Exports/Imports (-)
Dry Natural Gas, Net Exports/Imports (-)
Coal, Net Exports/Imports (-)
Total Electricity Net Generation
Total Electricity Net Consumption
Electricity, Net Exports/Imports (-)
Total Conventional Thermal Electricity Net Generation
Total Primary Energy Consumption
Total Carbon Dioxide Emissions from the Consumption of Energy
Population