| Business / Energy Data |
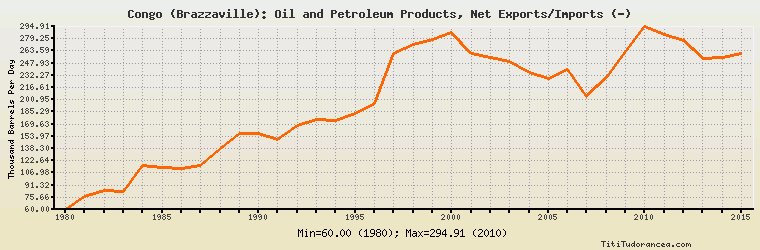
Congo (Brazzaville): Oil and Petroleum Products, Net Exports/Imports (-)
Thousand Barrels Per Day
| Year | Congo (Brazzaville) | Change, percent | Congo (Brazzaville), percent of Africa | Congo (Brazzaville), percent of World |
| 1980 | 60.000 | N/A | 1.262% | N/A |
| 1981 | 77.000 | 28.333% | 2.326% | N/A |
| 1982 | 84.000 | 9.091% | 2.607% | N/A |
| 1983 | 83.000 | -1.190% | 2.575% | N/A |
| 1984 | 117.000 | 40.964% | 3.259% | N/A |
| 1985 | 114.300 | -2.308% | 3.031% | N/A |
| 1986 | 113.200 | -0.962% | 3.053% | N/A |
| 1987 | 116.500 | 2.915% | 3.179% | N/A |
| 1988 | 138.200 | 18.627% | 3.512% | N/A |
| 1989 | 157.500 | 13.965% | 3.685% | N/A |
| 1990 | 157.900 | 0.254% | 3.396% | N/A |
| 1991 | 149.800 | -5.130% | 3.096% | N/A |
| 1992 | 168.200 | 12.283% | 3.422% | N/A |
| 1993 | 175.600 | 4.400% | 3.612% | N/A |
| 1994 | 174.700 | -0.513% | 3.600% | N/A |
| 1995 | 182.800 | 4.637% | 3.609% | N/A |
| 1996 | 196.000 | 7.221% | 3.758% | N/A |
| 1997 | 260.000 | 32.653% | 4.778% | N/A |
| 1998 | 271.900 | 4.577% | 5.051% | N/A |
| 1999 | 278.800 | 2.538% | 5.278% | N/A |
| 2000 | 287.507 | 3.123% | 5.294% | N/A |
| 2001 | 260.750 | -9.307% | 4.822% | N/A |
| 2002 | 255.162 | -2.143% | 4.701% | N/A |
| 2003 | 249.523 | -2.210% | 4.265% | N/A |
| 2004 | 236.227 | -5.329% | 3.650% | N/A |
| 2005 | 228.276 | -3.366% | 3.207% | N/A |
| 2006 | 239.096 | 4.740% | 3.327% | N/A |
| 2007 | 204.551 | -14.448% | 2.752% | N/A |
| 2008 | 229.878 | 12.382% | 3.109% | N/A |
| 2009 | 262.487 | 14.185% | 3.701% | N/A |
| 2010 | 294.913 | 12.353% | 4.121% | N/A |
| 2011 | 284.912 | -3.391% | 4.888% | N/A |
| 2012 | 276.892 | -2.815% | 4.415% | N/A |
| 2013 | 253.892 | -8.306% | 4.657% | N/A |
| 2014 | 254.892 | 0.394% | 5.362% | N/A |
| 2015 | 259.922 | 1.973% | 5.597% | N/A |
Historical Energy Data about Congo (Brazzaville)
Total Oil Supply
Total Consumption of Petroleum Products
Oil and Petroleum Products, Net Exports/Imports (-)
Production of Crude Oil including Lease Condensate
Crude Oil Proved Reserves
Dry Natural Gas Production
Dry Natural Gas Consumption
Dry Natural Gas, Net Exports/Imports (-)
Proved Reserves of Natural Gas
Coal, Net Exports/Imports (-)
Total Electricity Net Generation
Total Electricity Net Consumption
Total Electricity Imports
Electricity, Net Exports/Imports (-)
Total Conventional Thermal Electricity Net Generation
Hydroelectricity Net Generation
Total Biofuels Production
Total Primary Energy Production
Total Primary Energy Consumption
Total Carbon Dioxide Emissions from the Consumption of Energy
Population