| Business / Energy Data |
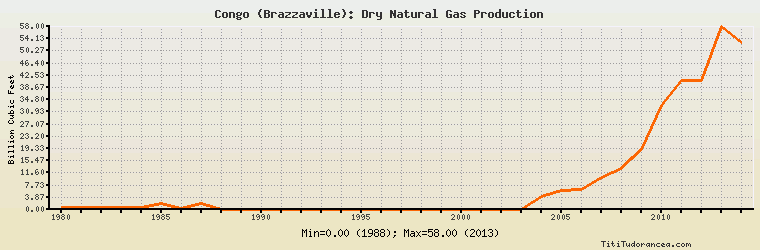
Congo (Brazzaville): Dry Natural Gas Production
Billion Cubic Feet
| Year | Congo (Brazzaville) | Change, percent | Congo (Brazzaville), percent of Africa | Congo (Brazzaville), percent of World |
| 1980 | 0.500 | N/A | 0.073% | 0.001% |
| 1981 | 0.600 | 20.000% | 0.058% | 0.001% |
| 1982 | 0.600 | 0.000% | 0.048% | 0.001% |
| 1983 | 0.700 | 16.667% | 0.042% | 0.001% |
| 1984 | 0.700 | 0.000% | 0.039% | 0.001% |
| 1985 | 2.000 | 185.714% | 0.108% | 0.003% |
| 1986 | 0.400 | -80.000% | 0.021% | 0.001% |
| 1987 | 2.000 | 400.000% | 0.095% | 0.003% |
| 1988 | 0.000 | -100.000% | 0.00% | 0.00% |
| 1989 | 0.000 | 0.000% | 0.00% | 0.00% |
| 1990 | 0.000 | 0.000% | 0.00% | 0.00% |
| 1991 | 0.000 | 0.000% | 0.00% | 0.00% |
| 1992 | 0.000 | 0.000% | 0.00% | 0.00% |
| 1993 | 0.000 | 0.000% | 0.00% | 0.00% |
| 1994 | 0.000 | 0.000% | 0.00% | 0.00% |
| 1995 | 0.000 | 0.000% | 0.00% | 0.00% |
| 1996 | 0.000 | 0.000% | 0.00% | 0.00% |
| 1997 | 0.000 | 0.000% | 0.00% | 0.00% |
| 1998 | 0.000 | 0.000% | 0.00% | 0.00% |
| 1999 | 0.000 | 0.000% | 0.00% | 0.00% |
| 2000 | 0.000 | 0.000% | 0.00% | 0.00% |
| 2001 | 0.000 | 0.000% | 0.00% | 0.00% |
| 2002 | 0.000 | 0.000% | 0.00% | 0.00% |
| 2003 | 0.000 | 0.000% | 0.00% | 0.00% |
| 2004 | 4.200 | 0.000% | 0.079% | 0.004% |
| 2005 | 6.000 | 42.857% | 0.096% | 0.006% |
| 2006 | 6.400 | 6.667% | 0.097% | 0.006% |
| 2007 | 10.000 | 56.250% | 0.148% | 0.010% |
| 2008 | 13.000 | 30.000% | 0.174% | 0.012% |
| 2009 | 19.000 | 46.154% | 0.267% | 0.018% |
| 2010 | 33.000 | 73.684% | 0.447% | 0.029% |
| 2011 | 41.000 | 24.242% | 0.576% | 0.035% |
| 2012 | 41.000 | 0.000% | 0.525% | 0.034% |
| 2013 | 58.000 | 41.463% | 0.788% | 0.048% |
| 2014 | 53.000 | -8.621% | 0.720% | 0.043% |
Historical Energy Data about Congo (Brazzaville)
Total Oil Supply
Total Consumption of Petroleum Products
Oil and Petroleum Products, Net Exports/Imports (-)
Production of Crude Oil including Lease Condensate
Crude Oil Proved Reserves
Dry Natural Gas Production
Dry Natural Gas Consumption
Dry Natural Gas, Net Exports/Imports (-)
Proved Reserves of Natural Gas
Coal, Net Exports/Imports (-)
Total Electricity Net Generation
Total Electricity Net Consumption
Total Electricity Imports
Electricity, Net Exports/Imports (-)
Total Conventional Thermal Electricity Net Generation
Hydroelectricity Net Generation
Total Biofuels Production
Total Primary Energy Production
Total Primary Energy Consumption
Total Carbon Dioxide Emissions from the Consumption of Energy
Population