| Business / Energy Data |
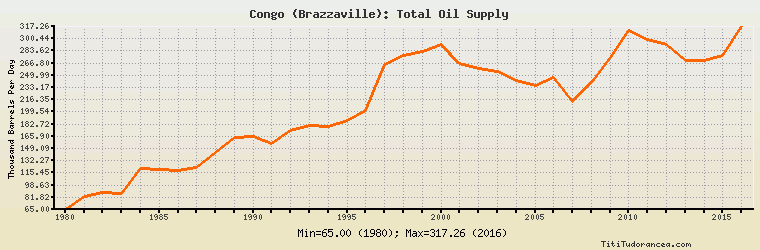
Congo (Brazzaville): Total Oil Supply
Thousand Barrels Per Day
| Year | Congo (Brazzaville) | Change, percent | Congo (Brazzaville), percent of Africa | Congo (Brazzaville), percent of World |
| 1980 | 65.000 | N/A | 1.044% | 0.102% |
| 1981 | 83.000 | 27.692% | 1.698% | 0.137% |
| 1982 | 89.000 | 7.229% | 1.823% | 0.153% |
| 1983 | 87.000 | -2.247% | 1.768% | 0.150% |
| 1984 | 121.000 | 39.080% | 2.262% | 0.203% |
| 1985 | 120.000 | -0.826% | 2.143% | 0.203% |
| 1986 | 119.000 | -0.833% | 2.153% | 0.193% |
| 1987 | 123.000 | 3.361% | 2.235% | 0.198% |
| 1988 | 144.000 | 17.073% | 2.465% | 0.224% |
| 1989 | 164.000 | 13.889% | 2.622% | 0.250% |
| 1990 | 165.000 | 0.610% | 2.456% | 0.248% |
| 1991 | 156.000 | -5.455% | 2.243% | 0.235% |
| 1992 | 174.000 | 11.538% | 2.461% | 0.261% |
| 1993 | 181.000 | 4.023% | 2.572% | 0.270% |
| 1994 | 180.000 | -0.552% | 2.558% | 0.262% |
| 1995 | 188.000 | 4.444% | 2.569% | 0.267% |
| 1996 | 201.000 | 6.915% | 2.672% | 0.279% |
| 1997 | 265.000 | 31.841% | 3.391% | 0.357% |
| 1998 | 277.000 | 4.528% | 3.557% | 0.366% |
| 1999 | 283.000 | 2.166% | 3.660% | 0.378% |
| 2000 | 291.907 | 3.147% | 3.654% | 0.376% |
| 2001 | 266.350 | -8.755% | 3.318% | 0.343% |
| 2002 | 259.962 | -2.398% | 3.195% | 0.337% |
| 2003 | 255.523 | -1.708% | 2.969% | 0.321% |
| 2004 | 242.927 | -4.929% | 2.606% | 0.291% |
| 2005 | 235.876 | -2.903% | 2.338% | 0.277% |
| 2006 | 247.296 | 4.842% | 2.426% | 0.290% |
| 2007 | 213.651 | -13.605% | 2.038% | 0.251% |
| 2008 | 239.878 | 12.276% | 2.268% | 0.277% |
| 2009 | 274.487 | 14.428% | 2.631% | 0.320% |
| 2010 | 311.913 | 13.635% | 2.921% | 0.353% |
| 2011 | 298.912 | -4.168% | 3.223% | 0.337% |
| 2012 | 291.892 | -2.349% | 2.944% | 0.322% |
| 2013 | 269.892 | -7.537% | 2.914% | 0.296% |
| 2014 | 270.892 | 0.371% | 3.099% | 0.289% |
| 2015 | 277.922 | 2.595% | 3.215% | 0.287% |
| 2016 | 317.255 | 14.153% | 3.869% | 0.327% |
Historical Energy Data about Congo (Brazzaville)
Total Oil Supply
Total Consumption of Petroleum Products
Oil and Petroleum Products, Net Exports/Imports (-)
Production of Crude Oil including Lease Condensate
Crude Oil Proved Reserves
Dry Natural Gas Production
Dry Natural Gas Consumption
Dry Natural Gas, Net Exports/Imports (-)
Proved Reserves of Natural Gas
Coal, Net Exports/Imports (-)
Total Electricity Net Generation
Total Electricity Net Consumption
Total Electricity Imports
Electricity, Net Exports/Imports (-)
Total Conventional Thermal Electricity Net Generation
Hydroelectricity Net Generation
Total Biofuels Production
Total Primary Energy Production
Total Primary Energy Consumption
Total Carbon Dioxide Emissions from the Consumption of Energy
Population