| Business / Energy Data |
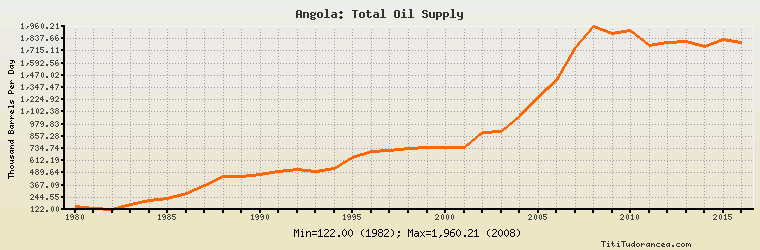
Angola: Total Oil Supply
Thousand Barrels Per Day
| Year | Angola | Change, percent | Angola, percent of Africa | Angola, percent of World |
| 1980 | 150.000 | N/A | 2.408% | 0.234% |
| 1981 | 130.000 | -13.333% | 2.660% | 0.215% |
| 1982 | 122.000 | -6.154% | 2.499% | 0.210% |
| 1983 | 177.000 | 45.082% | 3.597% | 0.306% |
| 1984 | 208.000 | 17.514% | 3.889% | 0.349% |
| 1985 | 231.000 | 11.058% | 4.126% | 0.390% |
| 1986 | 281.000 | 21.645% | 5.084% | 0.457% |
| 1987 | 359.000 | 27.758% | 6.524% | 0.578% |
| 1988 | 451.000 | 25.627% | 7.719% | 0.700% |
| 1989 | 454.000 | 0.665% | 7.259% | 0.693% |
| 1990 | 474.000 | 4.405% | 7.055% | 0.713% |
| 1991 | 499.000 | 5.274% | 7.174% | 0.752% |
| 1992 | 526.000 | 5.411% | 7.439% | 0.790% |
| 1993 | 508.000 | -3.422% | 7.218% | 0.757% |
| 1994 | 535.000 | 5.315% | 7.602% | 0.780% |
| 1995 | 645.000 | 20.561% | 8.815% | 0.917% |
| 1996 | 708.000 | 9.767% | 9.413% | 0.984% |
| 1997 | 713.000 | 0.706% | 9.125% | 0.961% |
| 1998 | 735.000 | 3.086% | 9.437% | 0.971% |
| 1999 | 745.000 | 1.361% | 9.635% | 0.995% |
| 2000 | 746.113 | 0.149% | 9.338% | 0.960% |
| 2001 | 741.904 | -0.564% | 9.241% | 0.955% |
| 2002 | 896.143 | 20.790% | 11.015% | 1.162% |
| 2003 | 902.305 | 0.688% | 10.485% | 1.133% |
| 2004 | 1,054.415 | 16.858% | 11.312% | 1.264% |
| 2005 | 1,249.229 | 18.476% | 12.383% | 1.468% |
| 2006 | 1,419.917 | 13.663% | 13.928% | 1.667% |
| 2007 | 1,747.505 | 23.071% | 16.666% | 2.050% |
| 2008 | 1,960.206 | 12.172% | 18.529% | 2.263% |
| 2009 | 1,886.295 | -3.771% | 18.078% | 2.197% |
| 2010 | 1,918.114 | 1.687% | 17.961% | 2.174% |
| 2011 | 1,765.027 | -7.981% | 19.031% | 1.988% |
| 2012 | 1,796.270 | 1.770% | 18.116% | 1.979% |
| 2013 | 1,813.879 | 0.980% | 19.586% | 1.987% |
| 2014 | 1,755.837 | -3.200% | 20.084% | 1.871% |
| 2015 | 1,828.084 | 4.115% | 21.148% | 1.888% |
| 2016 | 1,796.836 | -1.709% | 21.914% | 1.849% |
Historical Energy Data about Angola
Total Oil Supply
Total Consumption of Petroleum Products
Oil and Petroleum Products, Net Exports/Imports (-)
Production of Crude Oil including Lease Condensate
Crude Oil Proved Reserves
Dry Natural Gas Production
Dry Natural Gas Consumption
Dry Natural Gas, Net Exports/Imports (-)
Proved Reserves of Natural Gas
Coal, Net Exports/Imports (-)
Total Electricity Net Generation
Total Electricity Net Consumption
Electricity, Net Exports/Imports (-)
Total Conventional Thermal Electricity Net Generation
Hydroelectricity Net Generation
Total Primary Energy Production
Total Primary Energy Consumption
Total Carbon Dioxide Emissions from the Consumption of Energy
Population