| Business / Energy Data |
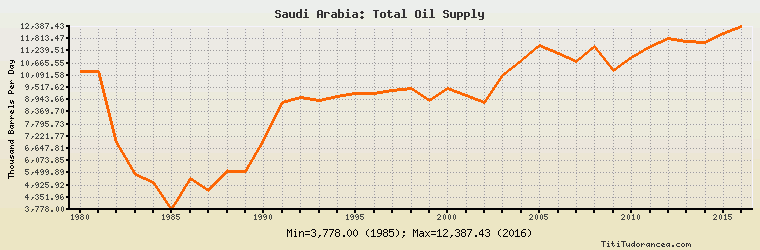
Saudi Arabia: Total Oil Supply
Thousand Barrels Per Day
| Year | Saudi Arabia | Change, percent | Saudi Arabia, percent of Middle East | Saudi Arabia, percent of World |
| 1980 | 10,285.000 | N/A | 54.063% | 16.073% |
| 1981 | 10,265.000 | -0.194% | 62.527% | 16.938% |
| 1982 | 6,929.000 | -32.499% | 52.090% | 11.926% |
| 1983 | 5,430.000 | -21.634% | 44.432% | 9.373% |
| 1984 | 5,033.000 | -7.311% | 41.868% | 8.450% |
| 1985 | 3,778.000 | -24.935% | 34.342% | 6.386% |
| 1986 | 5,255.000 | 39.095% | 39.990% | 8.540% |
| 1987 | 4,674.000 | -11.056% | 34.297% | 7.526% |
| 1988 | 5,577.000 | 19.320% | 36.473% | 8.660% |
| 1989 | 5,555.000 | -0.394% | 32.990% | 8.478% |
| 1990 | 7,019.000 | 26.355% | 40.226% | 10.565% |
| 1991 | 8,790.000 | 25.232% | 51.539% | 13.250% |
| 1992 | 9,036.000 | 2.799% | 49.227% | 13.577% |
| 1993 | 8,894.000 | -1.571% | 46.101% | 13.254% |
| 1994 | 9,101.000 | 2.327% | 45.428% | 13.261% |
| 1995 | 9,235.000 | 1.472% | 45.220% | 13.135% |
| 1996 | 9,238.000 | 0.032% | 44.806% | 12.833% |
| 1997 | 9,400.000 | 1.754% | 43.863% | 12.665% |
| 1998 | 9,472.000 | 0.766% | 41.617% | 12.516% |
| 1999 | 8,907.000 | -5.965% | 40.276% | 11.902% |
| 2000 | 9,475.749 | 6.385% | 40.349% | 12.191% |
| 2001 | 9,156.640 | -3.368% | 40.173% | 11.789% |
| 2002 | 8,809.507 | -3.791% | 40.840% | 11.426% |
| 2003 | 10,076.811 | 14.386% | 43.827% | 12.656% |
| 2004 | 10,796.241 | 7.139% | 43.064% | 12.937% |
| 2005 | 11,496.308 | 6.484% | 44.061% | 13.507% |
| 2006 | 11,098.439 | -3.461% | 43.060% | 13.027% |
| 2007 | 10,748.623 | -3.152% | 42.508% | 12.609% |
| 2008 | 11,428.600 | 6.326% | 42.701% | 13.191% |
| 2009 | 10,314.712 | -9.746% | 40.727% | 12.015% |
| 2010 | 10,908.355 | 5.755% | 41.602% | 12.361% |
| 2011 | 11,469.901 | 5.148% | 41.446% | 12.916% |
| 2012 | 11,840.683 | 3.233% | 42.468% | 13.043% |
| 2013 | 11,701.512 | -1.175% | 42.593% | 12.818% |
| 2014 | 11,623.703 | -0.665% | 41.605% | 12.389% |
| 2015 | 12,072.060 | 3.857% | 41.073% | 12.471% |
| 2016 | 12,387.432 | 2.612% | 39.960% | 12.749% |
Historical Energy Data about Saudi Arabia
Total Oil Supply
Total Consumption of Petroleum Products
Oil and Petroleum Products, Net Exports/Imports (-)
Production of Crude Oil including Lease Condensate
Crude Oil Proved Reserves
Dry Natural Gas Production
Dry Natural Gas Consumption
Proved Reserves of Natural Gas
Total Coal Consumption
Coal, Net Exports/Imports (-)
Total Electricity Net Generation
Total Electricity Net Consumption
Electricity, Net Exports/Imports (-)
Total Conventional Thermal Electricity Net Generation
Total Primary Energy Production
Total Primary Energy Consumption
Total Carbon Dioxide Emissions from the Consumption of Energy
Population