| Business / Energy Data |
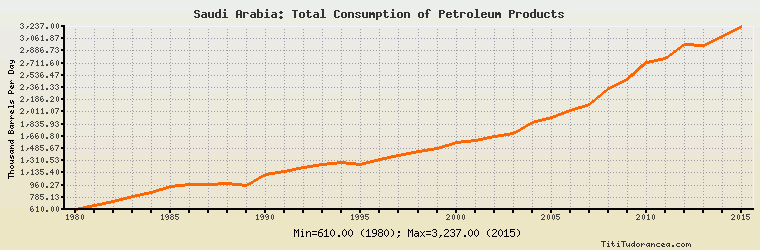
Saudi Arabia: Total Consumption of Petroleum Products
Thousand Barrels Per Day
| Year | Saudi Arabia | Change, percent | Saudi Arabia, percent of Middle East | Saudi Arabia, percent of World |
| 1980 | 610.000 | N/A | 29.829% | 0.972% |
| 1981 | 670.000 | 9.836% | 30.692% | 1.099% |
| 1982 | 720.000 | 7.463% | 30.822% | 1.209% |
| 1983 | 790.000 | 9.722% | 30.490% | 1.344% |
| 1984 | 850.000 | 7.595% | 32.295% | 1.421% |
| 1985 | 939.000 | 10.471% | 33.122% | 1.563% |
| 1986 | 974.000 | 3.727% | 32.872% | 1.576% |
| 1987 | 975.000 | 0.103% | 32.030% | 1.545% |
| 1988 | 990.000 | 1.538% | 31.509% | 1.524% |
| 1989 | 950.000 | -4.040% | 29.204% | 1.437% |
| 1990 | 1,107.000 | 16.526% | 31.774% | 1.664% |
| 1991 | 1,159.000 | 4.697% | 32.796% | 1.725% |
| 1992 | 1,219.000 | 5.177% | 32.628% | 1.810% |
| 1993 | 1,260.000 | 3.363% | 32.102% | 1.865% |
| 1994 | 1,286.000 | 2.063% | 31.290% | 1.867% |
| 1995 | 1,255.000 | -2.411% | 30.248% | 1.791% |
| 1996 | 1,332.000 | 6.135% | 31.542% | 1.858% |
| 1997 | 1,384.000 | 3.904% | 31.283% | 1.885% |
| 1998 | 1,439.000 | 3.974% | 31.695% | 1.943% |
| 1999 | 1,479.000 | 2.780% | 32.001% | 1.950% |
| 2000 | 1,568.946 | 6.082% | 31.812% | 2.036% |
| 2001 | 1,607.450 | 2.454% | 31.109% | 2.068% |
| 2002 | 1,657.025 | 3.084% | 31.535% | 2.113% |
| 2003 | 1,700.013 | 2.594% | 31.838% | 2.123% |
| 2004 | 1,852.033 | 8.942% | 32.605% | 2.226% |
| 2005 | 1,936.514 | 4.562% | 32.066% | 2.288% |
| 2006 | 2,030.454 | 4.851% | 32.441% | 2.369% |
| 2007 | 2,115.995 | 4.213% | 32.798% | 2.446% |
| 2008 | 2,351.717 | 11.140% | 33.488% | 2.746% |
| 2009 | 2,472.645 | 5.142% | 33.617% | 2.889% |
| 2010 | 2,715.808 | 9.834% | 35.439% | 3.046% |
| 2011 | 2,784.719 | 2.537% | 35.520% | 3.098% |
| 2012 | 2,979.729 | 7.003% | 36.203% | 3.271% |
| 2013 | 2,963.508 | -0.544% | 36.045% | 3.210% |
| 2014 | 3,086.476 | 4.149% | 36.252% | 3.297% |
| 2015 | 3,237.000 | 4.877% | 37.182% | 3.394% |
Historical Energy Data about Saudi Arabia
Total Oil Supply
Total Consumption of Petroleum Products
Oil and Petroleum Products, Net Exports/Imports (-)
Production of Crude Oil including Lease Condensate
Crude Oil Proved Reserves
Dry Natural Gas Production
Dry Natural Gas Consumption
Proved Reserves of Natural Gas
Total Coal Consumption
Coal, Net Exports/Imports (-)
Total Electricity Net Generation
Total Electricity Net Consumption
Electricity, Net Exports/Imports (-)
Total Conventional Thermal Electricity Net Generation
Total Primary Energy Production
Total Primary Energy Consumption
Total Carbon Dioxide Emissions from the Consumption of Energy
Population