| Business / Energy Data |
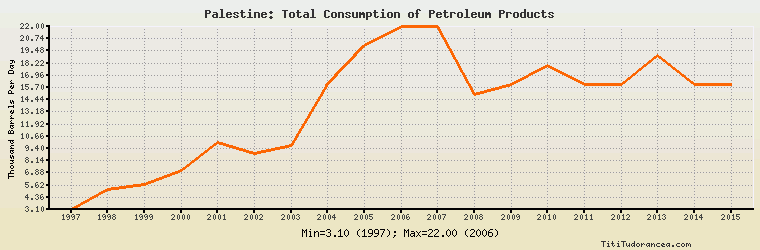
Palestine: Total Consumption of Petroleum Products
Thousand Barrels Per Day
| Year | Palestine | Change, percent | Palestine, percent of Middle East | Palestine, percent of World |
| 1980 | N/A | N/A | N/A | N/A |
| 1981 | N/A | N/A | N/A | N/A |
| 1982 | N/A | N/A | N/A | N/A |
| 1983 | N/A | N/A | N/A | N/A |
| 1984 | N/A | N/A | N/A | N/A |
| 1985 | N/A | N/A | N/A | N/A |
| 1986 | N/A | N/A | N/A | N/A |
| 1987 | N/A | N/A | N/A | N/A |
| 1988 | N/A | N/A | N/A | N/A |
| 1989 | N/A | N/A | N/A | N/A |
| 1990 | N/A | N/A | N/A | N/A |
| 1991 | N/A | N/A | N/A | N/A |
| 1992 | N/A | N/A | N/A | N/A |
| 1993 | N/A | N/A | N/A | N/A |
| 1994 | N/A | N/A | N/A | N/A |
| 1995 | N/A | N/A | N/A | N/A |
| 1996 | N/A | N/A | N/A | N/A |
| 1997 | 3.100 | N/A | 0.070% | 0.004% |
| 1998 | 5.200 | 67.742% | 0.115% | 0.007% |
| 1999 | 5.700 | 9.615% | 0.123% | 0.008% |
| 2000 | 7.100 | 24.561% | 0.144% | 0.009% |
| 2001 | 10.000 | 40.845% | 0.194% | 0.013% |
| 2002 | 8.900 | -11.000% | 0.169% | 0.011% |
| 2003 | 9.700 | 8.989% | 0.182% | 0.012% |
| 2004 | 16.000 | 64.948% | 0.282% | 0.019% |
| 2005 | 20.000 | 25.000% | 0.331% | 0.024% |
| 2006 | 22.000 | 10.000% | 0.351% | 0.026% |
| 2007 | 22.000 | 0.000% | 0.341% | 0.025% |
| 2008 | 15.000 | -31.818% | 0.214% | 0.018% |
| 2009 | 16.000 | 6.667% | 0.218% | 0.019% |
| 2010 | 18.000 | 12.500% | 0.235% | 0.020% |
| 2011 | 16.000 | -11.111% | 0.204% | 0.018% |
| 2012 | 16.000 | 0.000% | 0.194% | 0.018% |
| 2013 | 19.000 | 18.750% | 0.231% | 0.021% |
| 2014 | 16.000 | -15.789% | 0.188% | 0.017% |
| 2015 | 16.000 | 0.000% | 0.184% | 0.017% |
Historical Energy Data about Palestine
Total Consumption of Petroleum Products
Oil and Petroleum Products, Net Exports/Imports (-)
Dry Natural Gas, Net Exports/Imports (-)
Total Coal Consumption
Coal, Net Exports/Imports (-)
Total Electricity Net Generation
Total Electricity Net Consumption
Total Electricity Imports
Electricity, Net Exports/Imports (-)
Total Conventional Thermal Electricity Net Generation
Total Primary Energy Consumption
Total Carbon Dioxide Emissions from the Consumption of Energy
Population