| Business / Energy Data |
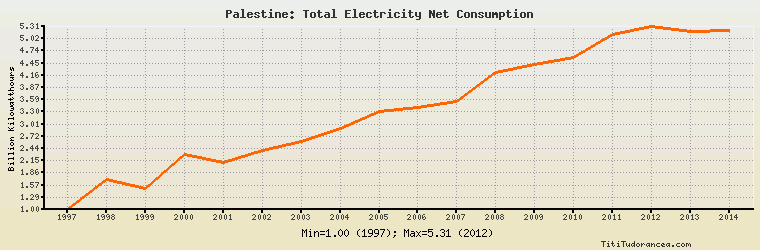
Palestine: Total Electricity Net Consumption
Billion Kilowatthours
| Year | Palestine | Change, percent | Palestine, percent of Middle East | Palestine, percent of World |
| 1980 | N/A | N/A | N/A | N/A |
| 1981 | N/A | N/A | N/A | N/A |
| 1982 | N/A | N/A | N/A | N/A |
| 1983 | N/A | N/A | N/A | N/A |
| 1984 | N/A | N/A | N/A | N/A |
| 1985 | N/A | N/A | N/A | N/A |
| 1986 | N/A | N/A | N/A | N/A |
| 1987 | N/A | N/A | N/A | N/A |
| 1988 | N/A | N/A | N/A | N/A |
| 1989 | N/A | N/A | N/A | N/A |
| 1990 | N/A | N/A | N/A | N/A |
| 1991 | N/A | N/A | N/A | N/A |
| 1992 | N/A | N/A | N/A | N/A |
| 1993 | N/A | N/A | N/A | N/A |
| 1994 | N/A | N/A | N/A | N/A |
| 1995 | N/A | N/A | N/A | N/A |
| 1996 | N/A | N/A | N/A | N/A |
| 1997 | 1.000 | N/A | 0.311% | 0.008% |
| 1998 | 1.700 | 70.000% | 0.487% | 0.014% |
| 1999 | 1.500 | -11.765% | 0.414% | 0.012% |
| 2000 | 2.300 | 53.333% | 0.595% | 0.017% |
| 2001 | 2.100 | -8.696% | 0.510% | 0.016% |
| 2002 | 2.400 | 14.286% | 0.547% | 0.017% |
| 2003 | 2.600 | 8.333% | 0.555% | 0.018% |
| 2004 | 2.900 | 11.538% | 0.590% | 0.019% |
| 2005 | 3.299 | 13.759% | 0.628% | 0.021% |
| 2006 | 3.397 | 2.971% | 0.598% | 0.021% |
| 2007 | 3.553 | 4.592% | 0.595% | 0.021% |
| 2008 | 4.236 | 19.223% | 0.673% | 0.024% |
| 2009 | 4.420 | 4.344% | 0.661% | 0.025% |
| 2010 | 4.573 | 3.462% | 0.622% | 0.025% |
| 2011 | 5.120 | 11.962% | 0.679% | 0.026% |
| 2012 | 5.312 | 3.750% | 0.672% | 0.027% |
| 2013 | 5.201 | -2.090% | 0.633% | 0.026% |
| 2014 | 5.229 | 0.538% | 0.598% | 0.025% |
Historical Energy Data about Palestine
Total Consumption of Petroleum Products
Oil and Petroleum Products, Net Exports/Imports (-)
Dry Natural Gas, Net Exports/Imports (-)
Total Coal Consumption
Coal, Net Exports/Imports (-)
Total Electricity Net Generation
Total Electricity Net Consumption
Total Electricity Imports
Electricity, Net Exports/Imports (-)
Total Conventional Thermal Electricity Net Generation
Total Primary Energy Consumption
Total Carbon Dioxide Emissions from the Consumption of Energy
Population