| Business / Energy Data |
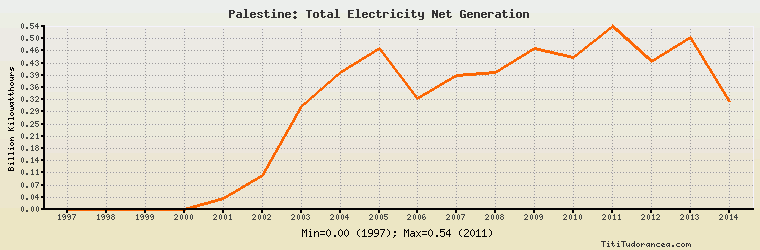
Palestine: Total Electricity Net Generation
Billion Kilowatthours
| Year | Palestine | Change, percent | Palestine, percent of Middle East | Palestine, percent of World |
| 1980 | N/A | N/A | N/A | N/A |
| 1981 | N/A | N/A | N/A | N/A |
| 1982 | N/A | N/A | N/A | N/A |
| 1983 | N/A | N/A | N/A | N/A |
| 1984 | N/A | N/A | N/A | N/A |
| 1985 | N/A | N/A | N/A | N/A |
| 1986 | N/A | N/A | N/A | N/A |
| 1987 | N/A | N/A | N/A | N/A |
| 1988 | N/A | N/A | N/A | N/A |
| 1989 | N/A | N/A | N/A | N/A |
| 1990 | N/A | N/A | N/A | N/A |
| 1991 | N/A | N/A | N/A | N/A |
| 1992 | N/A | N/A | N/A | N/A |
| 1993 | N/A | N/A | N/A | N/A |
| 1994 | N/A | N/A | N/A | N/A |
| 1995 | N/A | N/A | N/A | N/A |
| 1996 | N/A | N/A | N/A | N/A |
| 1997 | 0.000 | N/A | 0.00% | 0.00% |
| 1998 | 0.000 | 0.000% | 0.00% | 0.00% |
| 1999 | 0.000 | 0.000% | 0.00% | 0.00% |
| 2000 | 0.000 | 0.000% | 0.00% | 0.00% |
| 2001 | 0.033 | 0.000% | 0.007% | 0.000% |
| 2002 | 0.100 | 203.030% | 0.020% | 0.001% |
| 2003 | 0.300 | 200.000% | 0.057% | 0.002% |
| 2004 | 0.400 | 33.333% | 0.072% | 0.002% |
| 2005 | 0.470 | 17.500% | 0.077% | 0.003% |
| 2006 | 0.324 | -31.064% | 0.050% | 0.002% |
| 2007 | 0.392 | 20.988% | 0.057% | 0.002% |
| 2008 | 0.400 | 2.041% | 0.054% | 0.002% |
| 2009 | 0.470 | 17.500% | 0.061% | 0.002% |
| 2010 | 0.445 | -5.319% | 0.053% | 0.002% |
| 2011 | 0.535 | 20.225% | 0.062% | 0.003% |
| 2012 | 0.433 | -19.065% | 0.048% | 0.002% |
| 2013 | 0.502 | 15.935% | 0.054% | 0.002% |
| 2014 | 0.316 | -37.052% | 0.032% | 0.001% |
Historical Energy Data about Palestine
Total Consumption of Petroleum Products
Oil and Petroleum Products, Net Exports/Imports (-)
Dry Natural Gas, Net Exports/Imports (-)
Total Coal Consumption
Coal, Net Exports/Imports (-)
Total Electricity Net Generation
Total Electricity Net Consumption
Total Electricity Imports
Electricity, Net Exports/Imports (-)
Total Conventional Thermal Electricity Net Generation
Total Primary Energy Consumption
Total Carbon Dioxide Emissions from the Consumption of Energy
Population