| Business / Energy Data |
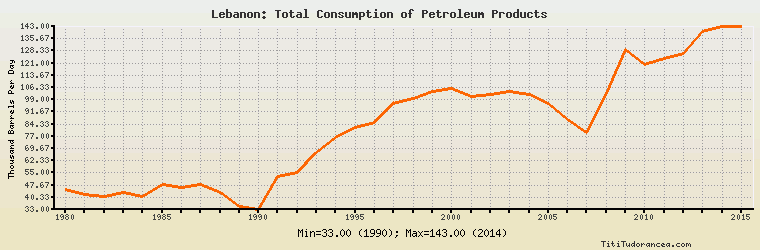
Lebanon: Total Consumption of Petroleum Products
Thousand Barrels Per Day
| Year | Lebanon | Change, percent | Lebanon, percent of Middle East | Lebanon, percent of World |
| 1980 | 45.000 | N/A | 2.200% | 0.072% |
| 1981 | 42.000 | -6.667% | 1.924% | 0.069% |
| 1982 | 41.000 | -2.381% | 1.755% | 0.069% |
| 1983 | 43.000 | 4.878% | 1.660% | 0.073% |
| 1984 | 41.000 | -4.651% | 1.558% | 0.069% |
| 1985 | 48.000 | 17.073% | 1.693% | 0.080% |
| 1986 | 46.000 | -4.167% | 1.552% | 0.074% |
| 1987 | 48.000 | 4.348% | 1.577% | 0.076% |
| 1988 | 43.000 | -10.417% | 1.369% | 0.066% |
| 1989 | 35.000 | -18.605% | 1.076% | 0.053% |
| 1990 | 33.000 | -5.714% | 0.947% | 0.050% |
| 1991 | 53.000 | 60.606% | 1.500% | 0.079% |
| 1992 | 55.000 | 3.774% | 1.472% | 0.082% |
| 1993 | 67.000 | 21.818% | 1.707% | 0.099% |
| 1994 | 76.000 | 13.433% | 1.849% | 0.110% |
| 1995 | 82.000 | 7.895% | 1.976% | 0.117% |
| 1996 | 85.000 | 3.659% | 2.013% | 0.119% |
| 1997 | 97.000 | 14.118% | 2.193% | 0.132% |
| 1998 | 100.000 | 3.093% | 2.203% | 0.135% |
| 1999 | 104.000 | 4.000% | 2.250% | 0.137% |
| 2000 | 106.000 | 1.923% | 2.149% | 0.138% |
| 2001 | 101.000 | -4.717% | 1.955% | 0.130% |
| 2002 | 102.000 | 0.990% | 1.941% | 0.130% |
| 2003 | 104.000 | 1.961% | 1.948% | 0.130% |
| 2004 | 102.000 | -1.923% | 1.796% | 0.123% |
| 2005 | 97.000 | -4.902% | 1.606% | 0.115% |
| 2006 | 87.000 | -10.309% | 1.390% | 0.102% |
| 2007 | 79.000 | -9.195% | 1.224% | 0.091% |
| 2008 | 103.000 | 30.380% | 1.467% | 0.120% |
| 2009 | 129.000 | 25.243% | 1.754% | 0.151% |
| 2010 | 120.000 | -6.977% | 1.566% | 0.135% |
| 2011 | 124.000 | 3.333% | 1.582% | 0.138% |
| 2012 | 127.000 | 2.419% | 1.543% | 0.139% |
| 2013 | 140.000 | 10.236% | 1.703% | 0.152% |
| 2014 | 143.000 | 2.143% | 1.680% | 0.153% |
| 2015 | 143.000 | 0.000% | 1.643% | 0.150% |
Historical Energy Data about Lebanon
Total Oil Supply
Total Consumption of Petroleum Products
Oil and Petroleum Products, Net Exports/Imports (-)
Dry Natural Gas, Net Exports/Imports (-)
Total Coal Consumption
Coal, Net Exports/Imports (-)
Total Electricity Net Generation
Total Electricity Net Consumption
Total Electricity Imports
Electricity, Net Exports/Imports (-)
Total Conventional Thermal Electricity Net Generation
Hydroelectricity Net Generation
Total Primary Energy Production
Total Primary Energy Consumption
Total Carbon Dioxide Emissions from the Consumption of Energy
Population