| Business / Energy Data |
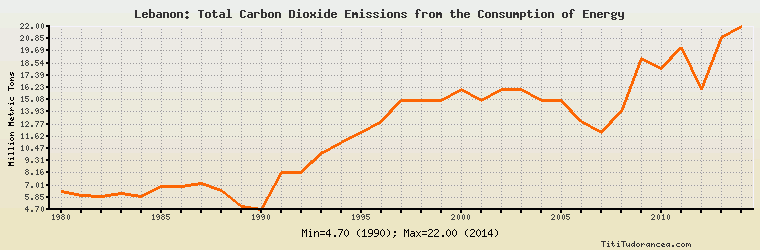
Lebanon: Total Carbon Dioxide Emissions from the Consumption of Energy
Million Metric Tons
| Year | Lebanon | Change, percent | Lebanon, percent of Middle East | Lebanon, percent of World |
| 1980 | 6.419 | N/A | 1.306% | 0.035% |
| 1981 | 6.000 | -6.527% | 1.283% | 0.033% |
| 1982 | 5.900 | -1.667% | 1.211% | 0.033% |
| 1983 | 6.200 | 5.085% | 1.168% | 0.034% |
| 1984 | 5.900 | -4.839% | 1.062% | 0.031% |
| 1985 | 6.900 | 16.949% | 1.196% | 0.036% |
| 1986 | 6.900 | 0.000% | 1.113% | 0.035% |
| 1987 | 7.200 | 4.348% | 1.115% | 0.035% |
| 1988 | 6.500 | -9.722% | 0.959% | 0.031% |
| 1989 | 5.000 | -23.077% | 0.705% | 0.023% |
| 1990 | 4.700 | -6.000% | 0.647% | 0.022% |
| 1991 | 8.200 | 74.468% | 1.049% | 0.038% |
| 1992 | 8.200 | 0.000% | 1.009% | 0.039% |
| 1993 | 10.000 | 21.951% | 1.198% | 0.047% |
| 1994 | 11.000 | 10.000% | 1.255% | 0.051% |
| 1995 | 12.000 | 9.091% | 1.338% | 0.055% |
| 1996 | 13.000 | 8.333% | 1.398% | 0.058% |
| 1997 | 15.000 | 15.385% | 1.527% | 0.067% |
| 1998 | 15.000 | 0.000% | 1.480% | 0.067% |
| 1999 | 15.000 | 0.000% | 1.428% | 0.066% |
| 2000 | 16.000 | 6.667% | 1.470% | 0.068% |
| 2001 | 15.000 | -6.250% | 1.345% | 0.063% |
| 2002 | 16.000 | 6.667% | 1.368% | 0.066% |
| 2003 | 16.000 | 0.000% | 1.293% | 0.062% |
| 2004 | 15.000 | -6.250% | 1.131% | 0.056% |
| 2005 | 15.000 | 0.000% | 1.041% | 0.054% |
| 2006 | 13.000 | -13.333% | 0.871% | 0.045% |
| 2007 | 12.000 | -7.692% | 0.785% | 0.041% |
| 2008 | 14.000 | 16.667% | 0.861% | 0.047% |
| 2009 | 19.000 | 35.714% | 1.092% | 0.064% |
| 2010 | 18.000 | -5.263% | 0.972% | 0.058% |
| 2011 | 20.000 | 11.111% | 1.028% | 0.062% |
| 2012 | 16.000 | -20.000% | 0.787% | 0.048% |
| 2013 | 21.000 | 31.250% | 1.039% | 0.062% |
| 2014 | 22.000 | 4.762% | 1.053% | 0.065% |
Historical Energy Data about Lebanon
Total Oil Supply
Total Consumption of Petroleum Products
Oil and Petroleum Products, Net Exports/Imports (-)
Dry Natural Gas, Net Exports/Imports (-)
Total Coal Consumption
Coal, Net Exports/Imports (-)
Total Electricity Net Generation
Total Electricity Net Consumption
Total Electricity Imports
Electricity, Net Exports/Imports (-)
Total Conventional Thermal Electricity Net Generation
Hydroelectricity Net Generation
Total Primary Energy Production
Total Primary Energy Consumption
Total Carbon Dioxide Emissions from the Consumption of Energy
Population