| Business / Energy Data |
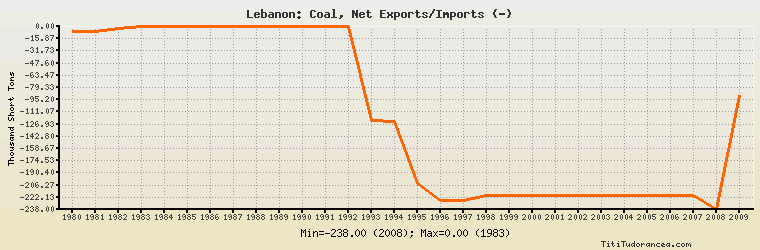
Lebanon: Coal, Net Exports/Imports (-)
Thousand Short Tons
| Year | Lebanon | Change, percent | Lebanon, percent of Middle East | Lebanon, percent of World |
| 1980 | -7.000 | N/A | 0.718% | N/A |
| 1981 | -7.000 | 0.000% | 1.071% | N/A |
| 1982 | -3.000 | -57.143% | 0.144% | N/A |
| 1983 | 0.000 | -100.000% | 0.00% | N/A |
| 1984 | 0.000 | 0.000% | 0.00% | N/A |
| 1985 | 0.000 | 0.000% | 0.00% | N/A |
| 1986 | 0.000 | 0.000% | 0.00% | N/A |
| 1987 | 0.000 | 0.000% | 0.00% | N/A |
| 1988 | 0.000 | 0.000% | 0.00% | N/A |
| 1989 | 0.000 | 0.000% | 0.00% | N/A |
| 1990 | 0.000 | 0.000% | 0.00% | N/A |
| 1991 | 0.000 | 0.000% | 0.00% | N/A |
| 1992 | 0.000 | 0.000% | 0.00% | N/A |
| 1993 | -122.000 | 0.000% | 1.793% | N/A |
| 1994 | -123.000 | 0.820% | 1.752% | N/A |
| 1995 | -204.000 | 65.854% | 2.649% | N/A |
| 1996 | -226.000 | 10.784% | 2.430% | N/A |
| 1997 | -226.000 | 0.000% | 2.255% | N/A |
| 1998 | -220.000 | -2.655% | 1.996% | N/A |
| 1999 | -220.000 | 0.000% | 2.040% | N/A |
| 2000 | -220.000 | 0.000% | 1.839% | N/A |
| 2001 | -220.000 | 0.000% | 1.641% | N/A |
| 2002 | -220.000 | 0.000% | 1.539% | N/A |
| 2003 | -220.000 | 0.000% | 1.485% | N/A |
| 2004 | -220.000 | 0.000% | 1.484% | N/A |
| 2005 | -220.000 | 0.000% | 1.490% | N/A |
| 2006 | -220.000 | 0.000% | 1.494% | N/A |
| 2007 | -220.000 | 0.000% | 1.433% | N/A |
| 2008 | -238.000 | 8.182% | 1.661% | N/A |
| 2009 | -90.000 | -62.185% | 0.599% | N/A |
Historical Energy Data about Lebanon
Total Oil Supply
Total Consumption of Petroleum Products
Oil and Petroleum Products, Net Exports/Imports (-)
Dry Natural Gas, Net Exports/Imports (-)
Total Coal Consumption
Coal, Net Exports/Imports (-)
Total Electricity Net Generation
Total Electricity Net Consumption
Total Electricity Imports
Electricity, Net Exports/Imports (-)
Total Conventional Thermal Electricity Net Generation
Hydroelectricity Net Generation
Total Primary Energy Production
Total Primary Energy Consumption
Total Carbon Dioxide Emissions from the Consumption of Energy
Population