| Business / Energy Data |
Bahrain: Total Consumption of Petroleum Products
Thousand Barrels Per Day
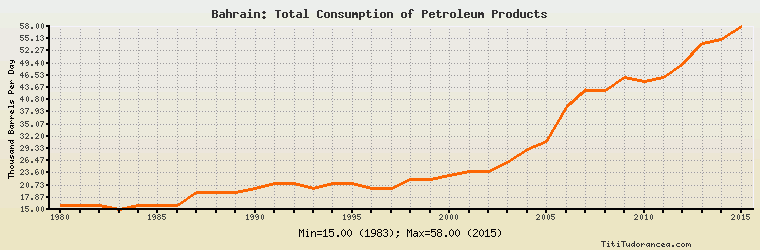
| Year | Bahrain | Change, percent | Bahrain, percent of Middle East | Bahrain, percent of World |
| 1980 | 16.000 | N/A | 0.782% | 0.025% |
| 1981 | 16.000 | 0.000% | 0.733% | 0.026% |
| 1982 | 16.000 | 0.000% | 0.685% | 0.027% |
| 1983 | 15.000 | -6.250% | 0.579% | 0.026% |
| 1984 | 16.000 | 6.667% | 0.608% | 0.027% |
| 1985 | 16.000 | 0.000% | 0.564% | 0.027% |
| 1986 | 16.000 | 0.000% | 0.540% | 0.026% |
| 1987 | 19.000 | 18.750% | 0.624% | 0.030% |
| 1988 | 19.000 | 0.000% | 0.605% | 0.029% |
| 1989 | 19.000 | 0.000% | 0.584% | 0.029% |
| 1990 | 20.000 | 5.263% | 0.574% | 0.030% |
| 1991 | 21.000 | 5.000% | 0.594% | 0.031% |
| 1992 | 21.000 | 0.000% | 0.562% | 0.031% |
| 1993 | 20.000 | -4.762% | 0.510% | 0.030% |
| 1994 | 21.000 | 5.000% | 0.511% | 0.030% |
| 1995 | 21.000 | 0.000% | 0.506% | 0.030% |
| 1996 | 20.000 | -4.762% | 0.474% | 0.028% |
| 1997 | 20.000 | 0.000% | 0.452% | 0.027% |
| 1998 | 22.000 | 10.000% | 0.485% | 0.030% |
| 1999 | 22.000 | 0.000% | 0.476% | 0.029% |
| 2000 | 23.000 | 4.545% | 0.466% | 0.030% |
| 2001 | 24.000 | 4.348% | 0.464% | 0.031% |
| 2002 | 24.000 | 0.000% | 0.457% | 0.031% |
| 2003 | 26.000 | 8.333% | 0.487% | 0.032% |
| 2004 | 29.000 | 11.538% | 0.511% | 0.035% |
| 2005 | 31.000 | 6.897% | 0.513% | 0.037% |
| 2006 | 39.000 | 25.806% | 0.623% | 0.046% |
| 2007 | 43.000 | 10.256% | 0.666% | 0.050% |
| 2008 | 43.000 | 0.000% | 0.612% | 0.050% |
| 2009 | 46.000 | 6.977% | 0.625% | 0.054% |
| 2010 | 45.000 | -2.174% | 0.587% | 0.050% |
| 2011 | 46.000 | 2.222% | 0.587% | 0.051% |
| 2012 | 49.000 | 6.522% | 0.595% | 0.054% |
| 2013 | 54.000 | 10.204% | 0.657% | 0.058% |
| 2014 | 55.000 | 1.852% | 0.646% | 0.059% |
| 2015 | 58.000 | 5.455% | 0.666% | 0.061% |
Historical Energy Data about Bahrain
Total Oil Supply
Total Consumption of Petroleum Products
Oil and Petroleum Products, Net Exports/Imports (-)
Production of Crude Oil including Lease Condensate
Crude Oil Proved Reserves
Dry Natural Gas Production
Dry Natural Gas Consumption
Dry Natural Gas, Net Exports/Imports (-)
Proved Reserves of Natural Gas
Coal, Net Exports/Imports (-)
Total Electricity Net Generation
Total Electricity Net Consumption
Electricity, Net Exports/Imports (-)
Total Conventional Thermal Electricity Net Generation
Total Primary Energy Production
Total Primary Energy Consumption
Total Carbon Dioxide Emissions from the Consumption of Energy
Population