| Business / Energy Data |
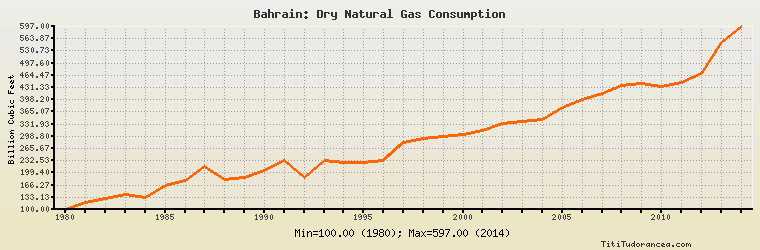
Bahrain: Dry Natural Gas Consumption
Billion Cubic Feet
| Year | Bahrain | Change, percent | Bahrain, percent of Middle East | Bahrain, percent of World |
| 1980 | 100.000 | N/A | 7.628% | 0.189% |
| 1981 | 120.000 | 20.000% | 9.232% | 0.224% |
| 1982 | 130.000 | 8.333% | 10.708% | 0.242% |
| 1983 | 140.000 | 7.692% | 9.805% | 0.256% |
| 1984 | 133.000 | -5.000% | 6.996% | 0.223% |
| 1985 | 164.000 | 23.308% | 7.215% | 0.264% |
| 1986 | 180.000 | 9.756% | 7.119% | 0.285% |
| 1987 | 217.000 | 20.556% | 7.408% | 0.328% |
| 1988 | 182.000 | -16.129% | 5.557% | 0.262% |
| 1989 | 186.000 | 2.198% | 5.195% | 0.256% |
| 1990 | 205.000 | 10.215% | 5.697% | 0.279% |
| 1991 | 233.000 | 13.659% | 6.428% | 0.309% |
| 1992 | 188.000 | -19.313% | 4.678% | 0.250% |
| 1993 | 234.000 | 24.468% | 5.473% | 0.304% |
| 1994 | 229.000 | -2.137% | 5.043% | 0.297% |
| 1995 | 229.000 | 0.000% | 4.837% | 0.290% |
| 1996 | 232.000 | 1.310% | 4.400% | 0.286% |
| 1997 | 281.000 | 21.121% | 4.805% | 0.347% |
| 1998 | 293.000 | 4.270% | 4.698% | 0.359% |
| 1999 | 297.000 | 1.365% | 4.604% | 0.354% |
| 2000 | 303.000 | 2.020% | 4.442% | 0.347% |
| 2001 | 314.000 | 3.630% | 4.454% | 0.358% |
| 2002 | 334.000 | 6.369% | 4.360% | 0.366% |
| 2003 | 340.000 | 1.796% | 4.254% | 0.363% |
| 2004 | 344.000 | 1.176% | 3.998% | 0.355% |
| 2005 | 378.000 | 9.884% | 3.848% | 0.380% |
| 2006 | 400.000 | 5.820% | 3.897% | 0.392% |
| 2007 | 416.000 | 4.000% | 3.897% | 0.394% |
| 2008 | 438.000 | 5.288% | 3.755% | 0.401% |
| 2009 | 441.000 | 0.685% | 3.527% | 0.418% |
| 2010 | 433.000 | -1.814% | 3.267% | 0.380% |
| 2011 | 446.000 | 3.002% | 3.179% | 0.381% |
| 2012 | 470.000 | 5.381% | 3.170% | 0.389% |
| 2013 | 554.000 | 17.872% | 3.605% | 0.451% |
| 2014 | 597.000 | 7.762% | 3.709% | 0.486% |
Historical Energy Data about Bahrain
Total Oil Supply
Total Consumption of Petroleum Products
Oil and Petroleum Products, Net Exports/Imports (-)
Production of Crude Oil including Lease Condensate
Crude Oil Proved Reserves
Dry Natural Gas Production
Dry Natural Gas Consumption
Dry Natural Gas, Net Exports/Imports (-)
Proved Reserves of Natural Gas
Coal, Net Exports/Imports (-)
Total Electricity Net Generation
Total Electricity Net Consumption
Electricity, Net Exports/Imports (-)
Total Conventional Thermal Electricity Net Generation
Total Primary Energy Production
Total Primary Energy Consumption
Total Carbon Dioxide Emissions from the Consumption of Energy
Population