| Business / Energy Data |
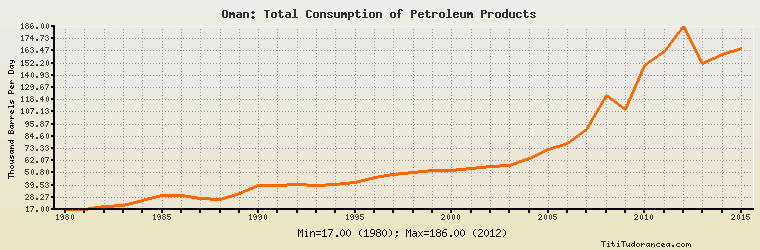
Oman: Total Consumption of Petroleum Products
Thousand Barrels Per Day
| Year | Oman | Change, percent | Oman, percent of Middle East | Oman, percent of World |
| 1980 | 17.000 | N/A | 0.831% | 0.027% |
| 1981 | 17.000 | 0.000% | 0.779% | 0.028% |
| 1982 | 20.000 | 17.647% | 0.856% | 0.034% |
| 1983 | 21.000 | 5.000% | 0.810% | 0.036% |
| 1984 | 25.000 | 19.048% | 0.950% | 0.042% |
| 1985 | 30.000 | 20.000% | 1.058% | 0.050% |
| 1986 | 30.000 | 0.000% | 1.012% | 0.049% |
| 1987 | 27.000 | -10.000% | 0.887% | 0.043% |
| 1988 | 26.000 | -3.704% | 0.827% | 0.040% |
| 1989 | 32.000 | 23.077% | 0.984% | 0.048% |
| 1990 | 39.000 | 21.875% | 1.119% | 0.059% |
| 1991 | 39.000 | 0.000% | 1.104% | 0.058% |
| 1992 | 40.000 | 2.564% | 1.071% | 0.059% |
| 1993 | 39.000 | -2.500% | 0.994% | 0.058% |
| 1994 | 40.000 | 2.564% | 0.973% | 0.058% |
| 1995 | 42.000 | 5.000% | 1.012% | 0.060% |
| 1996 | 47.000 | 11.905% | 1.113% | 0.066% |
| 1997 | 49.000 | 4.255% | 1.108% | 0.067% |
| 1998 | 51.000 | 4.082% | 1.123% | 0.069% |
| 1999 | 53.000 | 3.922% | 1.147% | 0.070% |
| 2000 | 53.000 | 0.000% | 1.075% | 0.069% |
| 2001 | 55.000 | 3.774% | 1.064% | 0.071% |
| 2002 | 57.000 | 3.636% | 1.085% | 0.073% |
| 2003 | 58.000 | 1.754% | 1.086% | 0.072% |
| 2004 | 64.000 | 10.345% | 1.127% | 0.077% |
| 2005 | 72.000 | 12.500% | 1.192% | 0.085% |
| 2006 | 78.000 | 8.333% | 1.246% | 0.091% |
| 2007 | 91.000 | 16.667% | 1.410% | 0.105% |
| 2008 | 122.000 | 34.066% | 1.737% | 0.142% |
| 2009 | 109.000 | -10.656% | 1.482% | 0.127% |
| 2010 | 150.000 | 37.615% | 1.957% | 0.168% |
| 2011 | 163.000 | 8.667% | 2.079% | 0.181% |
| 2012 | 186.000 | 14.110% | 2.260% | 0.204% |
| 2013 | 152.000 | -18.280% | 1.849% | 0.165% |
| 2014 | 160.000 | 5.263% | 1.879% | 0.171% |
| 2015 | 166.000 | 3.750% | 1.907% | 0.174% |
Historical Energy Data about Oman
Total Oil Supply
Total Consumption of Petroleum Products
Oil and Petroleum Products, Net Exports/Imports (-)
Production of Crude Oil including Lease Condensate
Crude Oil Proved Reserves
Dry Natural Gas Production
Dry Natural Gas Consumption
Dry Natural Gas, Net Exports/Imports (-)
Proved Reserves of Natural Gas
Coal, Net Exports/Imports (-)
Total Electricity Net Generation
Total Electricity Net Consumption
Electricity, Net Exports/Imports (-)
Total Conventional Thermal Electricity Net Generation
Total Primary Energy Production
Total Primary Energy Consumption
Total Carbon Dioxide Emissions from the Consumption of Energy
Population