| Business / Energy Data |
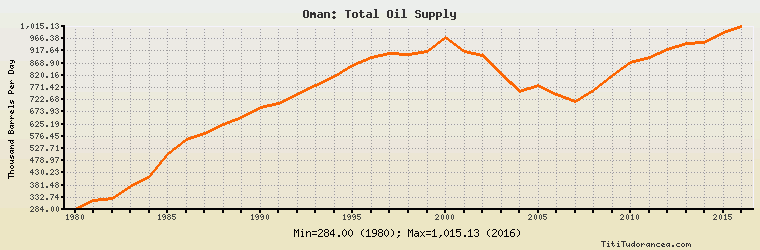
Oman: Total Oil Supply
Thousand Barrels Per Day
| Year | Oman | Change, percent | Oman, percent of Middle East | Oman, percent of World |
| 1980 | 284.000 | N/A | 1.493% | 0.444% |
| 1981 | 321.000 | 13.028% | 1.955% | 0.530% |
| 1982 | 326.000 | 1.558% | 2.451% | 0.561% |
| 1983 | 377.000 | 15.644% | 3.085% | 0.651% |
| 1984 | 417.000 | 10.610% | 3.469% | 0.700% |
| 1985 | 502.000 | 20.384% | 4.563% | 0.849% |
| 1986 | 563.000 | 12.151% | 4.284% | 0.915% |
| 1987 | 587.000 | 4.263% | 4.307% | 0.945% |
| 1988 | 622.000 | 5.963% | 4.068% | 0.966% |
| 1989 | 650.000 | 4.502% | 3.860% | 0.992% |
| 1990 | 693.000 | 6.615% | 3.972% | 1.043% |
| 1991 | 706.000 | 1.876% | 4.140% | 1.064% |
| 1992 | 744.000 | 5.382% | 4.053% | 1.118% |
| 1993 | 780.000 | 4.839% | 4.043% | 1.162% |
| 1994 | 814.000 | 4.359% | 4.063% | 1.186% |
| 1995 | 859.000 | 5.528% | 4.206% | 1.222% |
| 1996 | 891.000 | 3.725% | 4.322% | 1.238% |
| 1997 | 908.000 | 1.908% | 4.237% | 1.223% |
| 1998 | 904.000 | -0.441% | 3.972% | 1.194% |
| 1999 | 914.000 | 1.106% | 4.133% | 1.221% |
| 2000 | 972.041 | 6.350% | 4.139% | 1.251% |
| 2001 | 915.488 | -5.818% | 4.017% | 1.179% |
| 2002 | 899.484 | -1.748% | 4.170% | 1.167% |
| 2003 | 823.010 | -8.502% | 3.580% | 1.034% |
| 2004 | 754.297 | -8.349% | 3.009% | 0.904% |
| 2005 | 780.559 | 3.482% | 2.992% | 0.917% |
| 2006 | 743.860 | -4.702% | 2.886% | 0.873% |
| 2007 | 714.814 | -3.905% | 2.827% | 0.839% |
| 2008 | 759.700 | 6.279% | 2.838% | 0.877% |
| 2009 | 818.888 | 7.791% | 3.233% | 0.954% |
| 2010 | 869.417 | 6.170% | 3.316% | 0.985% |
| 2011 | 891.582 | 2.549% | 3.222% | 1.004% |
| 2012 | 924.684 | 3.713% | 3.317% | 1.019% |
| 2013 | 946.038 | 2.309% | 3.444% | 1.036% |
| 2014 | 951.765 | 0.605% | 3.407% | 1.014% |
| 2015 | 990.257 | 4.044% | 3.369% | 1.023% |
| 2016 | 1,015.126 | 2.511% | 3.275% | 1.045% |
Historical Energy Data about Oman
Total Oil Supply
Total Consumption of Petroleum Products
Oil and Petroleum Products, Net Exports/Imports (-)
Production of Crude Oil including Lease Condensate
Crude Oil Proved Reserves
Dry Natural Gas Production
Dry Natural Gas Consumption
Dry Natural Gas, Net Exports/Imports (-)
Proved Reserves of Natural Gas
Coal, Net Exports/Imports (-)
Total Electricity Net Generation
Total Electricity Net Consumption
Electricity, Net Exports/Imports (-)
Total Conventional Thermal Electricity Net Generation
Total Primary Energy Production
Total Primary Energy Consumption
Total Carbon Dioxide Emissions from the Consumption of Energy
Population