| Business / Energy Data |
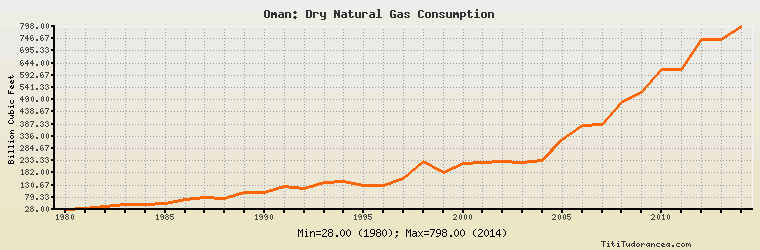
Oman: Dry Natural Gas Consumption
Billion Cubic Feet
| Year | Oman | Change, percent | Oman, percent of Middle East | Oman, percent of World |
| 1980 | 28.000 | N/A | 2.136% | 0.053% |
| 1981 | 33.000 | 17.857% | 2.539% | 0.062% |
| 1982 | 41.000 | 24.242% | 3.377% | 0.076% |
| 1983 | 51.000 | 24.390% | 3.572% | 0.093% |
| 1984 | 47.000 | -7.843% | 2.472% | 0.079% |
| 1985 | 55.000 | 17.021% | 2.420% | 0.088% |
| 1986 | 70.000 | 27.273% | 2.769% | 0.111% |
| 1987 | 80.000 | 14.286% | 2.731% | 0.121% |
| 1988 | 73.000 | -8.750% | 2.229% | 0.105% |
| 1989 | 99.000 | 35.616% | 2.765% | 0.136% |
| 1990 | 99.000 | 0.000% | 2.751% | 0.135% |
| 1991 | 124.000 | 25.253% | 3.421% | 0.165% |
| 1992 | 117.000 | -5.645% | 2.911% | 0.155% |
| 1993 | 140.000 | 19.658% | 3.275% | 0.182% |
| 1994 | 147.000 | 5.000% | 3.237% | 0.191% |
| 1995 | 130.000 | -11.565% | 2.746% | 0.164% |
| 1996 | 128.000 | -1.538% | 2.427% | 0.158% |
| 1997 | 159.000 | 24.219% | 2.719% | 0.196% |
| 1998 | 232.000 | 45.912% | 3.720% | 0.284% |
| 1999 | 182.000 | -21.552% | 2.822% | 0.217% |
| 2000 | 221.000 | 21.429% | 3.240% | 0.253% |
| 2001 | 224.000 | 1.357% | 3.177% | 0.255% |
| 2002 | 231.000 | 3.125% | 3.015% | 0.253% |
| 2003 | 226.000 | -2.165% | 2.828% | 0.241% |
| 2004 | 236.000 | 4.425% | 2.743% | 0.244% |
| 2005 | 324.000 | 37.288% | 3.298% | 0.326% |
| 2006 | 380.000 | 17.284% | 3.702% | 0.372% |
| 2007 | 384.000 | 1.053% | 3.598% | 0.364% |
| 2008 | 477.000 | 24.219% | 4.090% | 0.437% |
| 2009 | 520.000 | 9.015% | 4.159% | 0.492% |
| 2010 | 619.000 | 19.038% | 4.671% | 0.543% |
| 2011 | 619.000 | 0.000% | 4.412% | 0.528% |
| 2012 | 745.000 | 20.355% | 5.024% | 0.617% |
| 2013 | 743.000 | -0.268% | 4.834% | 0.605% |
| 2014 | 798.000 | 7.402% | 4.957% | 0.650% |
Historical Energy Data about Oman
Total Oil Supply
Total Consumption of Petroleum Products
Oil and Petroleum Products, Net Exports/Imports (-)
Production of Crude Oil including Lease Condensate
Crude Oil Proved Reserves
Dry Natural Gas Production
Dry Natural Gas Consumption
Dry Natural Gas, Net Exports/Imports (-)
Proved Reserves of Natural Gas
Coal, Net Exports/Imports (-)
Total Electricity Net Generation
Total Electricity Net Consumption
Electricity, Net Exports/Imports (-)
Total Conventional Thermal Electricity Net Generation
Total Primary Energy Production
Total Primary Energy Consumption
Total Carbon Dioxide Emissions from the Consumption of Energy
Population