| Business / Energy Data |
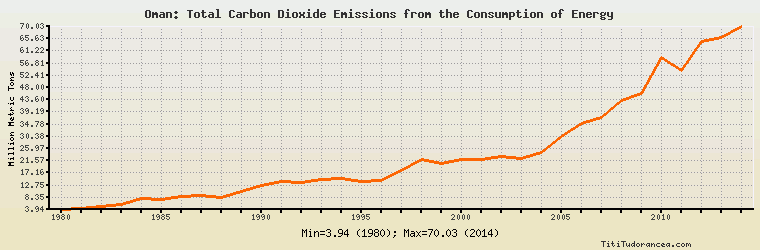
Oman: Total Carbon Dioxide Emissions from the Consumption of Energy
Million Metric Tons
| Year | Oman | Change, percent | Oman, percent of Middle East | Oman, percent of World |
| 1980 | 3.943 | N/A | 0.802% | 0.021% |
| 1981 | 4.157 | 5.427% | 0.889% | 0.023% |
| 1982 | 5.081 | 22.228% | 1.043% | 0.028% |
| 1983 | 5.812 | 14.387% | 1.095% | 0.032% |
| 1984 | 7.741 | 33.190% | 1.394% | 0.041% |
| 1985 | 7.441 | -3.875% | 1.290% | 0.038% |
| 1986 | 8.765 | 17.793% | 1.413% | 0.044% |
| 1987 | 8.904 | 1.586% | 1.379% | 0.044% |
| 1988 | 8.104 | -8.985% | 1.196% | 0.038% |
| 1989 | 10.393 | 28.245% | 1.465% | 0.049% |
| 1990 | 12.531 | 20.572% | 1.725% | 0.058% |
| 1991 | 14.184 | 13.191% | 1.814% | 0.067% |
| 1992 | 13.522 | -4.667% | 1.664% | 0.064% |
| 1993 | 14.740 | 9.008% | 1.767% | 0.069% |
| 1994 | 15.038 | 2.022% | 1.716% | 0.070% |
| 1995 | 14.153 | -5.885% | 1.578% | 0.065% |
| 1996 | 14.593 | 3.109% | 1.569% | 0.065% |
| 1997 | 17.958 | 23.059% | 1.828% | 0.080% |
| 1998 | 21.870 | 21.784% | 2.158% | 0.097% |
| 1999 | 20.543 | -6.068% | 1.955% | 0.090% |
| 2000 | 21.850 | 6.362% | 2.007% | 0.092% |
| 2001 | 22.166 | 1.446% | 1.988% | 0.093% |
| 2002 | 22.981 | 3.677% | 1.965% | 0.094% |
| 2003 | 22.498 | -2.102% | 1.819% | 0.088% |
| 2004 | 24.382 | 8.374% | 1.838% | 0.091% |
| 2005 | 30.259 | 24.104% | 2.100% | 0.109% |
| 2006 | 35.102 | 16.005% | 2.352% | 0.123% |
| 2007 | 37.313 | 6.299% | 2.442% | 0.127% |
| 2008 | 43.353 | 16.187% | 2.666% | 0.146% |
| 2009 | 45.797 | 5.637% | 2.632% | 0.155% |
| 2010 | 58.883 | 28.574% | 3.180% | 0.189% |
| 2011 | 54.173 | -7.999% | 2.784% | 0.167% |
| 2012 | 64.674 | 19.384% | 3.180% | 0.195% |
| 2013 | 65.951 | 1.975% | 3.262% | 0.196% |
| 2014 | 70.031 | 6.186% | 3.353% | 0.208% |
Historical Energy Data about Oman
Total Oil Supply
Total Consumption of Petroleum Products
Oil and Petroleum Products, Net Exports/Imports (-)
Production of Crude Oil including Lease Condensate
Crude Oil Proved Reserves
Dry Natural Gas Production
Dry Natural Gas Consumption
Dry Natural Gas, Net Exports/Imports (-)
Proved Reserves of Natural Gas
Coal, Net Exports/Imports (-)
Total Electricity Net Generation
Total Electricity Net Consumption
Electricity, Net Exports/Imports (-)
Total Conventional Thermal Electricity Net Generation
Total Primary Energy Production
Total Primary Energy Consumption
Total Carbon Dioxide Emissions from the Consumption of Energy
Population